Warpgroup is an R package for processing chromatography-mass spectrometry data. Warpgroup implements:
- Chromatogram subregion detection
- Consensus integration bound determination
- Accurate missing value integration
For more detailed information please see the publication in Bioinformatics
Warpgroup is available as an R package on GitHub: nathaniel-mahieu/warpgroup
#install.packages("devtools")
devtools::install_github("nathaniel-mahieu/warpgroup")library(warpgroup)
warpgroup.bounds = warpgroup(peak.bounds, eic.matrix, sc.aligned.lim = 8)The xcmsSet must include rough grouping information. The quality of resulting warpgroups depends on proper grouping and peak detection.
- xr.l: a list() containing an xcmsRaw object for each sample in the order of @filepaths
- rt.max.drift: The maximum retention time drift in seconds expected for a peak in the data set in scans. Used when setting the boundaries for looking for missing peaks.
- ppm.max.drift: The maximum mass drift expected for a peak in the data set in ppm. Used when setting the boundaries for looking for missing peaks. Determines how large a region surrounding the group is extracted in order to include any features which were not detected.
- rt.aligned.lim: Peak bounds after alignment are considered to describe the same region if they are within this limit.
# Parallel Backend Setup
library(doParallel)
cl = makeCluster(detectCores() - 1)
registerDoParallel(cl)

#Preprocessing (peak detection, grouping)
xs = xcmsSet(files, ...)
xs.r = retcor(xs, ...)
xs.rg = group(xs.r, ...)

#Warpgrouping
xr.l = llply(xs.rg@filepaths, xcmsRaw, profstep=0)
xs.warpgroup = group.warpgroup(xs.rg, xr.l = xr.l, rt.max.drift = 20, ppm.max.drift = 3, rt.aligned.lim = 5)Toy data and more examples can be found in the /inst directory.
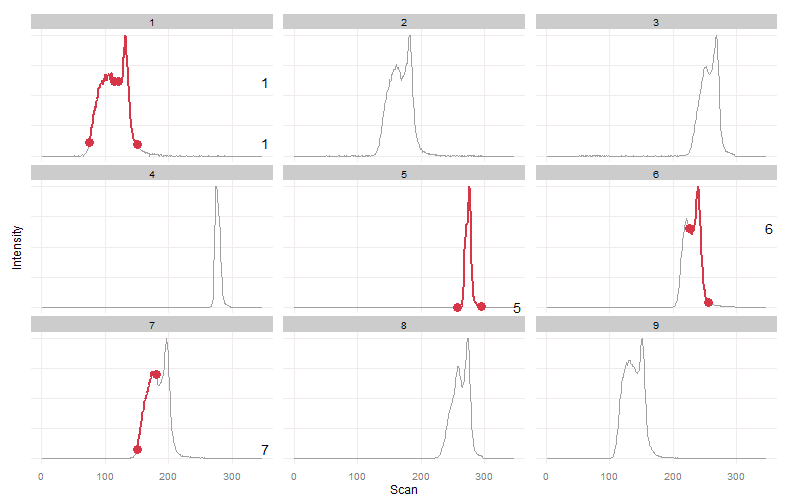
This is an extreme example, data this unreliable probably shouldn't be trusted, but it provides a nice challenge and conceptual overview of the algorithm.
data(example_5)

plot_peaks_bounds(eic.mat, peak.bounds)
We can clearly see two peaks in most samples. There is a large retention time drift. There is also a varying degree of merging between the two peaks. In some samples two distinct peaks were detected, in others a single peak was detected.
wg.bounds = warpgroup(peak.bounds, eic.mat, sc.max.drift = 0, sc.aligned.lim = 8)

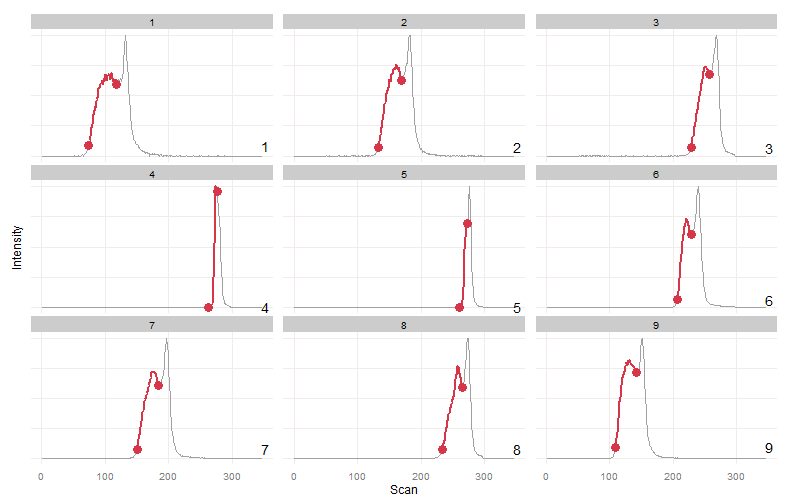
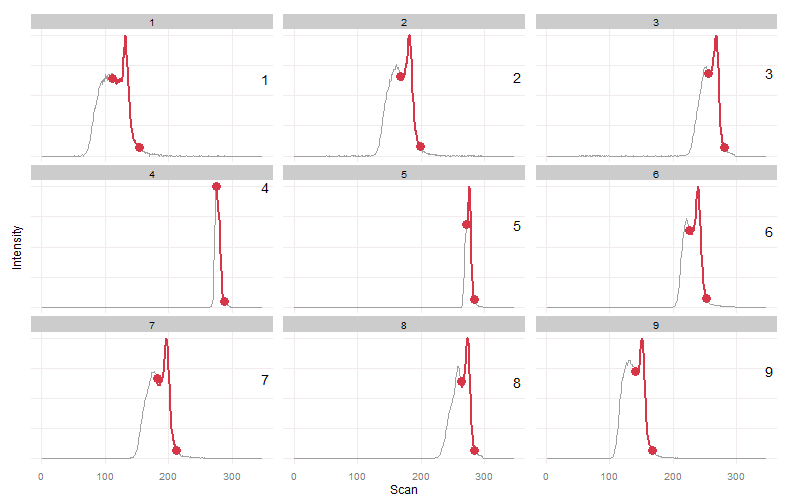
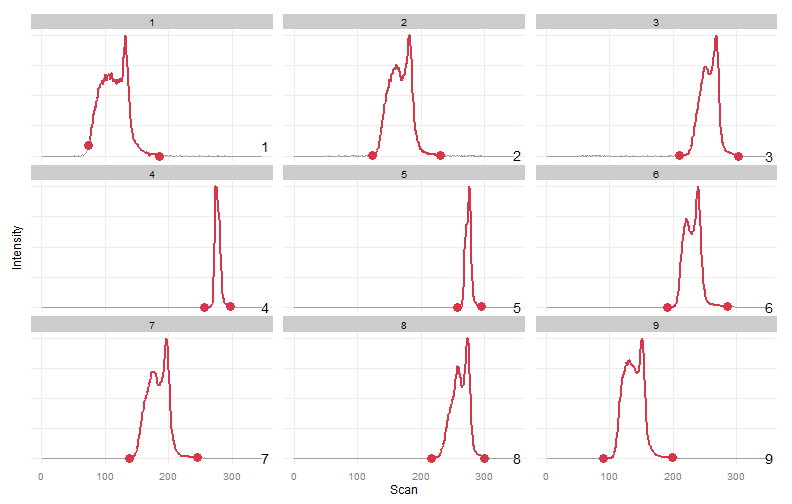
for (g in wg.bounds) print(plot_peaks_bounds(eic.mat, g))
Warpgroup generated three peak groups, each group describing a distinct chromatographic region and the same region in each sample.
This project is licensed under the terms of the GPL-3 license.


