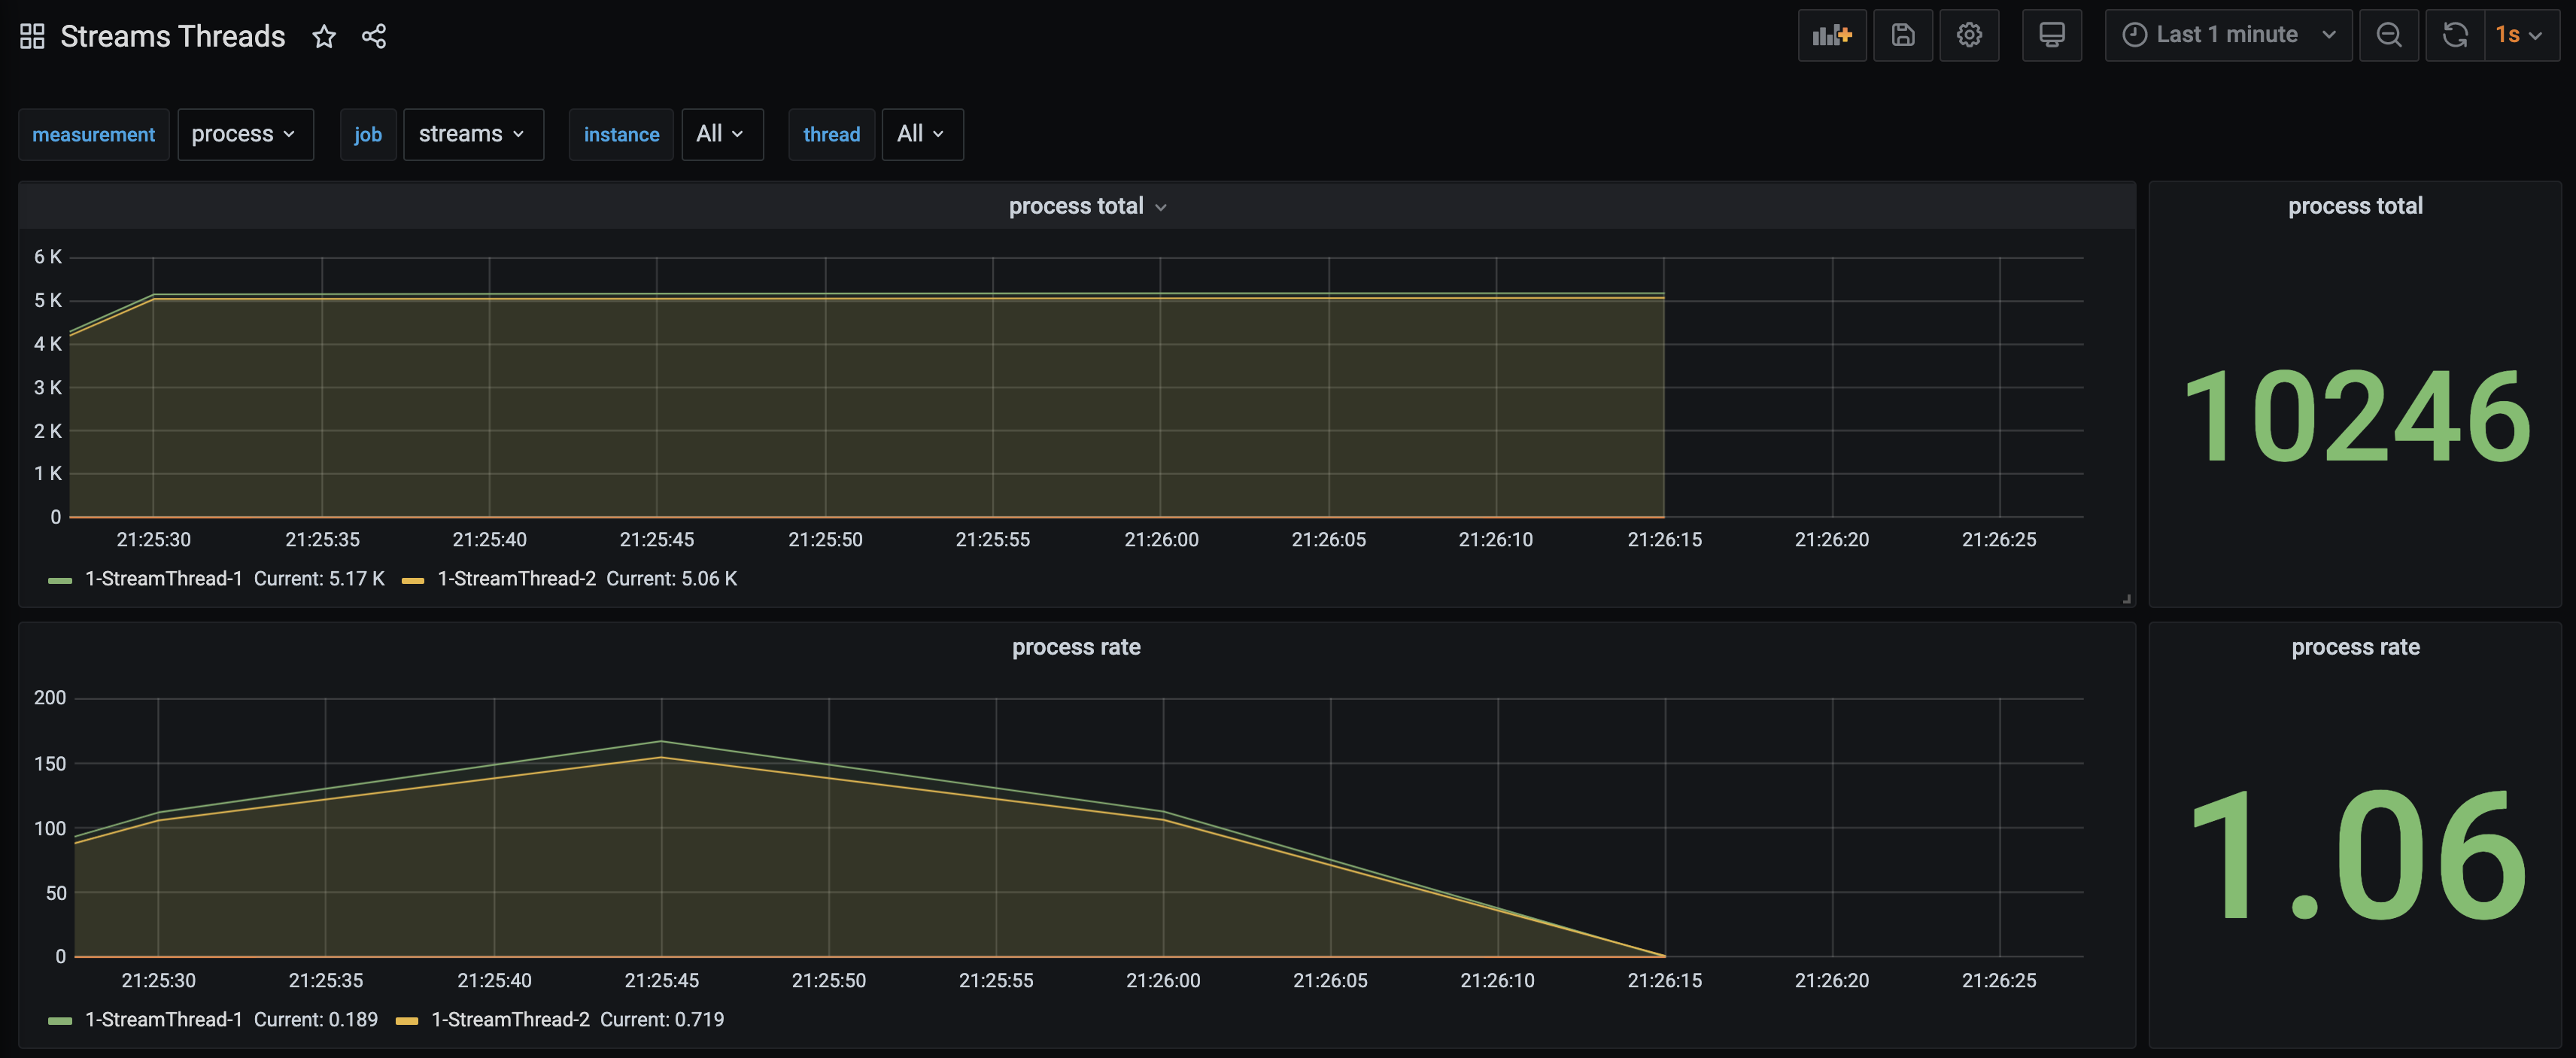
For an actively maintained set of dashboards and application to demonstrate those dashboards, please refer to the following
repository.
https://github.com/kineticedge/kafka-streams-dashboards
-
Showcases the monitoring of Kafka Streams Metrics
-
This is the code and dashboards as the basis of a Kafka Summit Europe 2021 presentation titled, What is the State of my Kafka Streams Application? Unleashing Metrics..
-
Leverages Docker and Docker Container extensively
-
Containers and Build is with Java 14, but Java 11 would work just fine (changing the build.gradle script accordingly)
-
Setup and Configuration all in the
./scripts/startup.shscript; execute from root directory to get everything running. -
Shut it all down, use
./scripts/teardown.shscript. -
Grafana Dashboard
-
https://localhost:3000 -
Credentials:
- username:
admin - password:
grafana
- username:
-
on MacOS your the grafana dashboard will auto open in your default browser.
-
-
This project leverages docker and docker compose for easy of demonstration.
-
to minimize having to start up all components, separate
docker-compose.ymlfor each logical-unit and a common bridge networkksd. -
docker compose .env files used to keep container names short and consistent but hopefully not clash with any existing docker containers you are using.
-
Kafka Brokers name/ports
broker internal (container) bootstrap-servers external (host-machine) bootstrap-servers broker-1 broker-1:9092 localhost:19092 broker-2 broker-2:9092 localhost:29092 broker-3 broker-3:9092 localhost:39092 broker-4 broker-4:9092 localhost:49092 -
The Kafka applications can run on the host machine utilizing the external names, the applications can run in containers using the internal hostnames.
-
Run the application within a container with internal configruation, so it can be part of the Grafana dashboard, since prometheus is running in a container and does have access to the host-name endpoint.
-
Run the applications externally for development or experimentation of the application
-
Each project will build a Docker image that then can be started with the 'applications' docker-compose.
-
-
The primary software libraries used in addition to Apache Kafka Client and Streams Libraries.
-
FasterXML Jackson
-
Lombok
-
JCommander
-
Slf4j API
-
Logback
-
Apache Commons
- lang3
- csv
-
The tools project provides custom deserializers to use to inspect key elements on a change-log topic.
scripts/enable-custom-tools-derserialerwill create a symbolic link to the tools jar file. This allows forkafka-console-consumerto utilize those deserializers. Inspect the script before running, to understand the modification it will do (expecially if your installation of Apache Kafka is not Confluent's.)
kafka-console-consumer \
   --bootstrap-server localhost:19092 \
   --property print.timestamp=true \
   --property print.partition=true \
   --property print.key=true \
   --property key.separator=\| \
   --key-deserializer=dev.buesing.ksd.tools.serde.SessionDeserializer \
   --topic analytics_session-SESSION-aggregate-purchase-order-changelog
