Allows for rendering of custom maps in 2D vanilla iOS views.
There is no dependency on external rendering services.
There is map data which needs to be downloaded and pre-processed using scripts as explained later on in this README. However, this can be done once for a region of the globe (one could do it for the entire globe/download the data from somewhere) based on MapBox data using even the Free API, and they play without consuming quote further.
A few powerful features allow for smartly rendering tiles only in the current location.
The project has been upgraded to working condition and Swift 5 as of 2021.
An UIScrollView is used as a viewport for a 2D based GPS map location game, a hello world for something like a pokemon go game
Visit this repository for a SceneKit based render, able to allow a more pokemon-go type 3D feel to the map, with cleaner code - but not working currently as it was based on mapzen, and doing post processing in UI, mapbox doesn't have a JSON format, only MVT, so would need some conversion to happen which I've not coded in, it could be changed to leverage what this repository does for post processing of data
https://github.com/nenuadrian/3D-GPS-location-map-rendering-game-base-swift-ios-scenekit
Assuming you have NodeJS and NPM installed
./setup.sh
This will just run some npm install's
Optional: Get an API key from MapBox.com and update tile-processor/index.js at the top if you want to generate new tiles in the future
In a terminal
cd game-nodejs-server
npm start
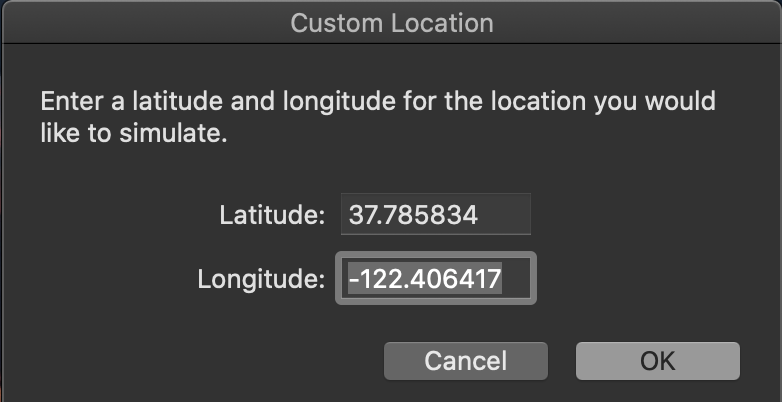
Start the APP in the simulator, click Feature -> Location -> Custom Location and you can use LAT 37.785834 LON -122.406417
The tiles to render this are the ones in the screenshots and are part of the codebase
- it dynamically decides which tiles to remove and which to render, a few tiles around the focus point for performance
- code is available to pre-cache tile data from mapbox, preprocess the data and serve it to the app via a a NodeJS API
- index.js is able to fetch tile data on mvt format from mapbox and convert it to JSON files
- index.php is able to read available files in the data folder as dumped by index.js and convert them from coordinates to meters and do some cleanup for the app to be able to use the data out of the box
- the app uses swift code to render the tiles
You need to understand a bit about the theory of how maps work, I am working by default with Zoom Level 16 For LAT 37.785834 LON -122.406417 that means tiles around x in range 10483 to 10555 and y in range 25320 to 25335
The planet is split into tiles, where level 16 means about 611 meters per tile.
An in-depth explanation has been saved and attached in web-maps-cartography-guide.pdf
You can find formulas for these computations on the web and in index.php
Change index.js for loop to generate different ranges of tiles, then run index.php (no parameters to any)
cd tile-processor
npm install
node index.js
php index.php


