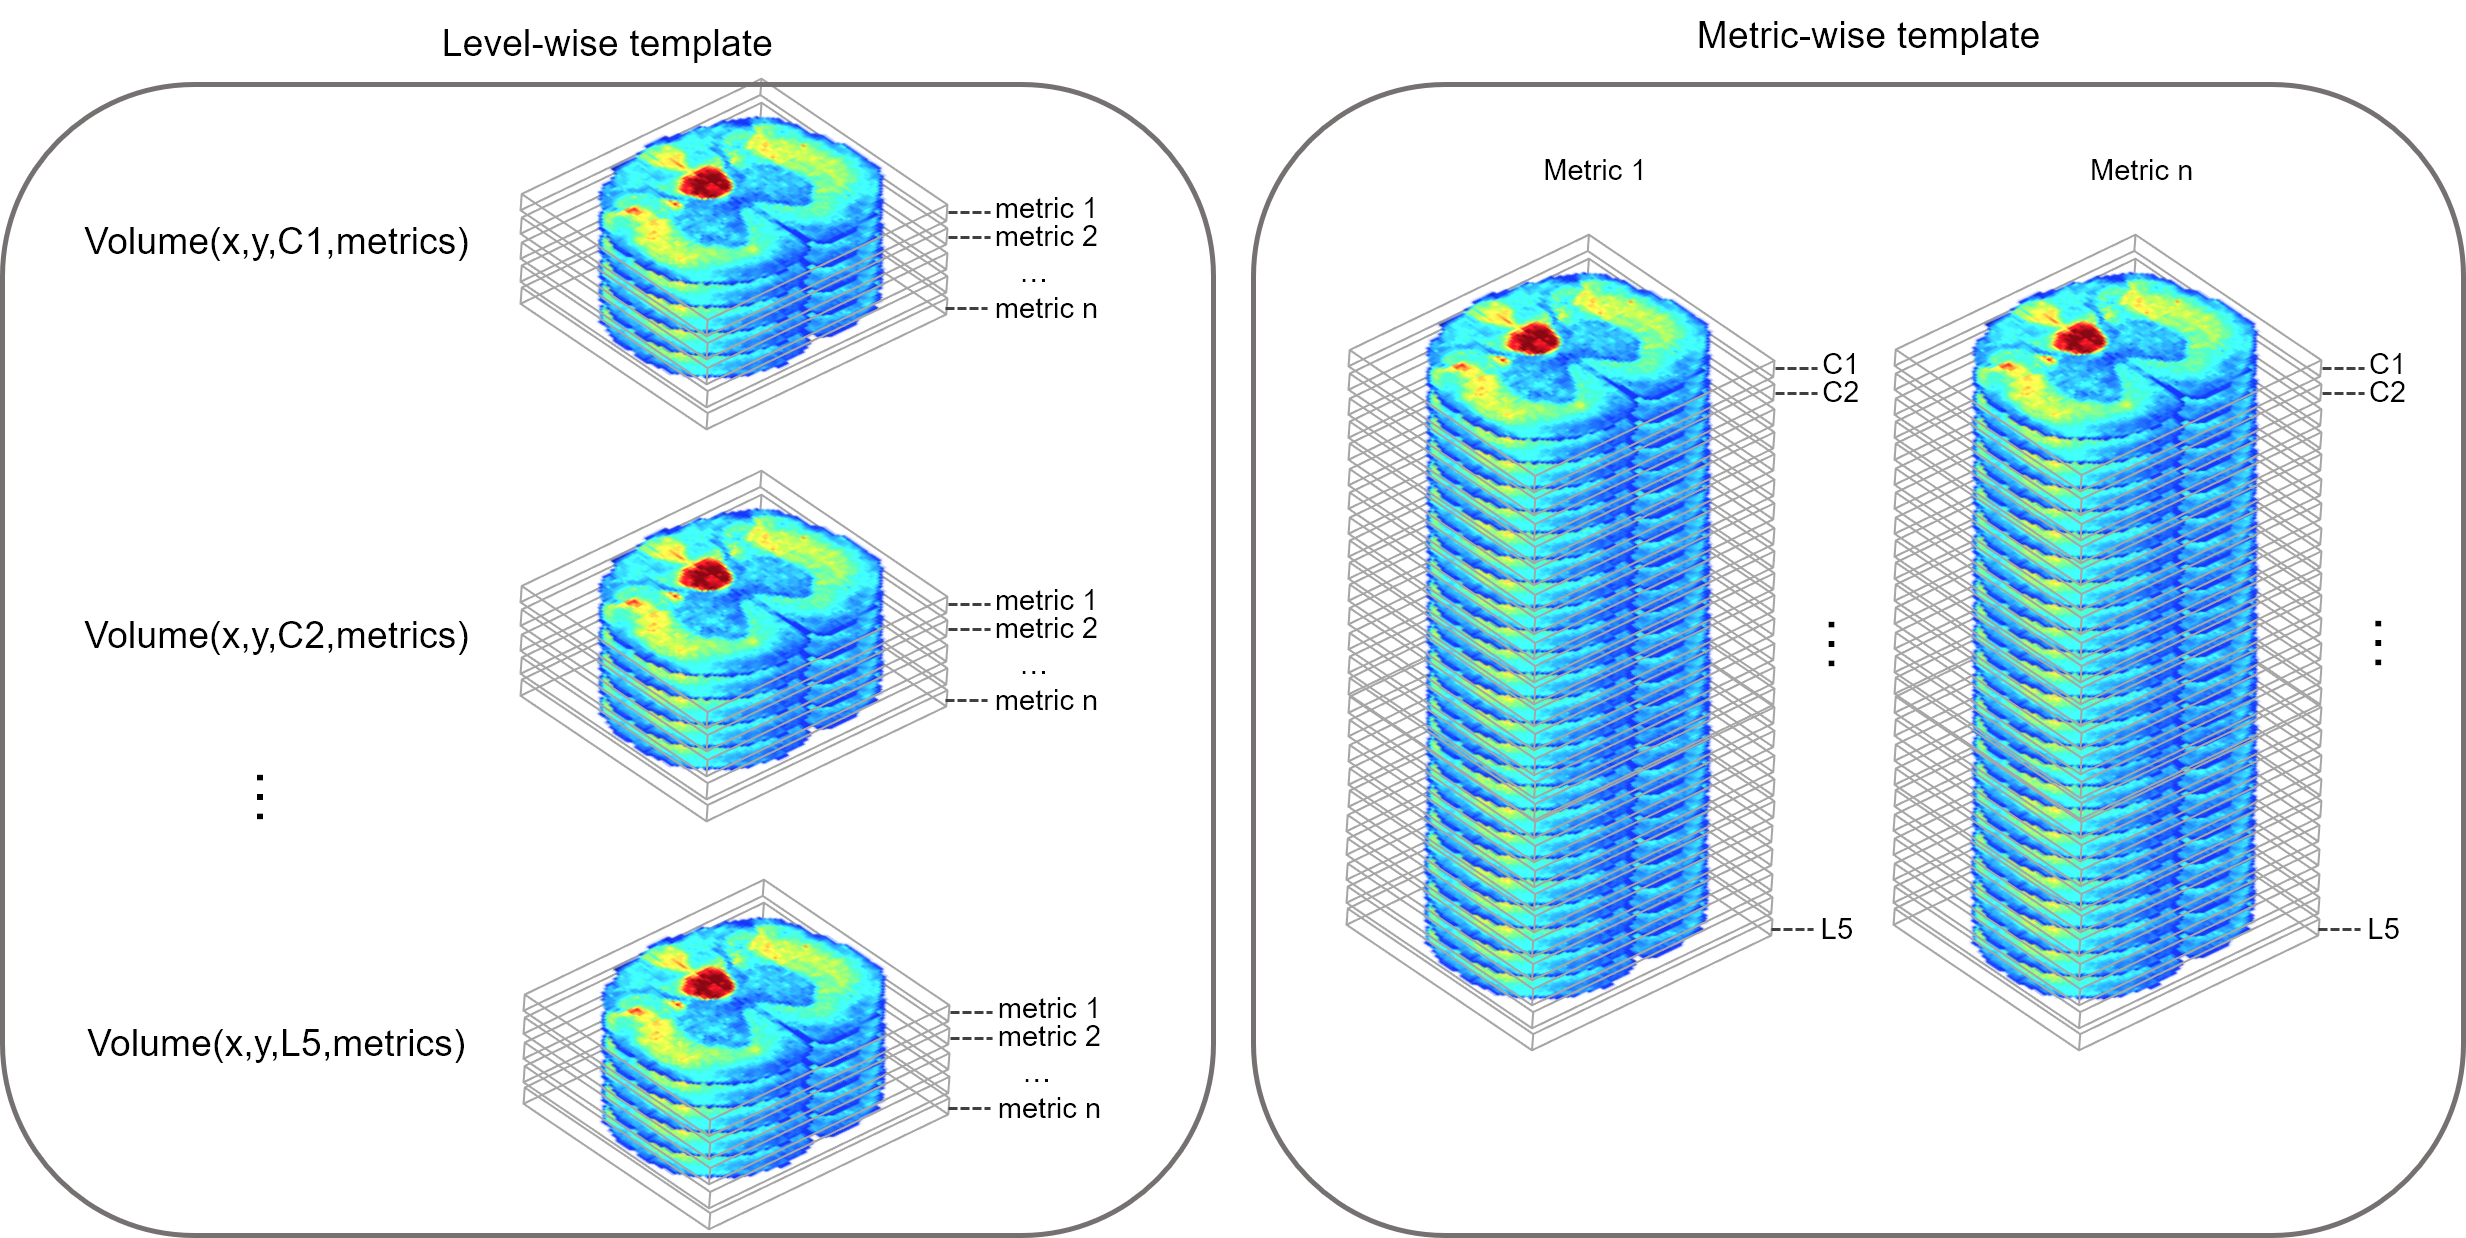
This pipeline is designed to generate an atlas of the spinal cord based on electron microscopy images. The output is a 4D nifti volume containing metrics obtained from scanning electron microscopy.
One slice corresponds to one spinal level: C1, C2, ... C8, T1, ...T13, L1, ... L6, S1, ... S4.
The 4th dimension contains the different metrics, in this order:
- Axon Density (AD)
- Axon Equivalent Diameter (AED)
- G-Ratio (GR)
- Myelin Thickness (MT)
- Myelin Volume Fraction (MVF)
The dataset that this pipeline is based on is available at: https://osf.io/g7kx8/. It contains the following data:
- Rats perfusion + histology
- Acquisition with EM
- Segment axon+myelin: Using Axonseg. Outputs: Axon density, Axon diameter, g-ratio, myelin thickness and MVF, downsampled at 50 um maps.
The data are organized as follows:
data_rat_spinalcord_atlas/
  C1/
    Sample1/
      Sample1_AD.nii.gz
      Sample1_AED.nii.gz
      Sample1_GR.nii.gz
      Sample1_MT.nii.gz
      Sample1_MVF.nii.gz
    Sample2/
      Sample2_AD.nii.gz
      Sample2_AED.nii.gz
      Sample2_GR.nii.gz
      Sample2_MT.nii.gz
      Sample2_MVF.nii.gz
    ...
    SampleN/
      SampleN_AD.nii.gz
      SampleN_AED.nii.gz
      SampleN_GR.nii.gz
      SampleN_MT.nii.gz
      SampleN_MVF.nii.gz

  C2/
    Sample1/
      Sample1_AD.nii.gz
      Sample1_AED.nii.gz
      Sample1_GR.nii.gz
      Sample1_MT.nii.gz
      Sample1_MVF.nii.gz
    Sample2/
      Sample2_AD.nii.gz
      Sample2_AED.nii.gz
      Sample2_GR.nii.gz
      Sample2_MT.nii.gz
      Sample2_MVF.nii.gz
    ...
    SampleN/
      SampleN_AD.nii.gz
      SampleN_AED.nii.gz
      SampleN_GR.nii.gz
      SampleN_MT.nii.gz
      SampleN_MVF.nii.gz
    ...
  L5/
    ...
- Open a terminal
- Clone this repository:
git clone https://github.com/neuropoly/atlas-rat
- Open Matlab
- Add the folder of this repository to the Matlab's dir using
pathtool(include subfolders)
-
Copy the file scatlas_parameters_template.m --> scatlas_parameters.m
-
Edit
scatlas_parameters.mand adjust parameters according to your setup. -
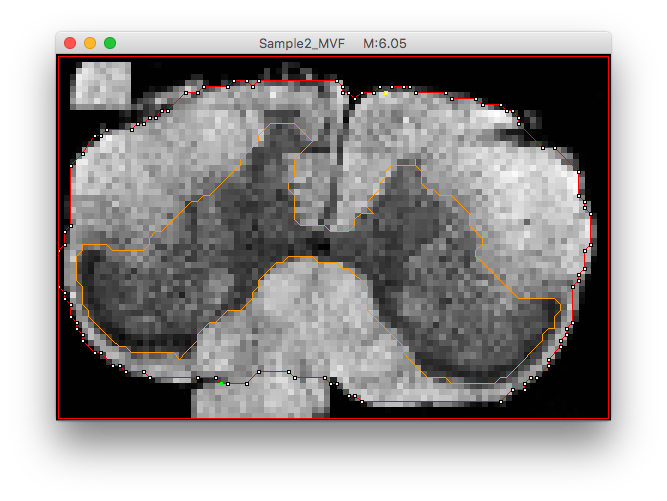
scatlas_create_mask.m: Create white matter masks and output referential image.
Alternative approach (faster, but not used here): Use MIPAV > LineWireVOI. Example below:
- scatlas_create_labels.m: This step is optional (labels are already included in the dataset). From the axon density map (), created labels by running:
The following labels need to be created:
Label1.mat: single point in the central canal
Label2.mat: single point in the anterior median fissure.
-
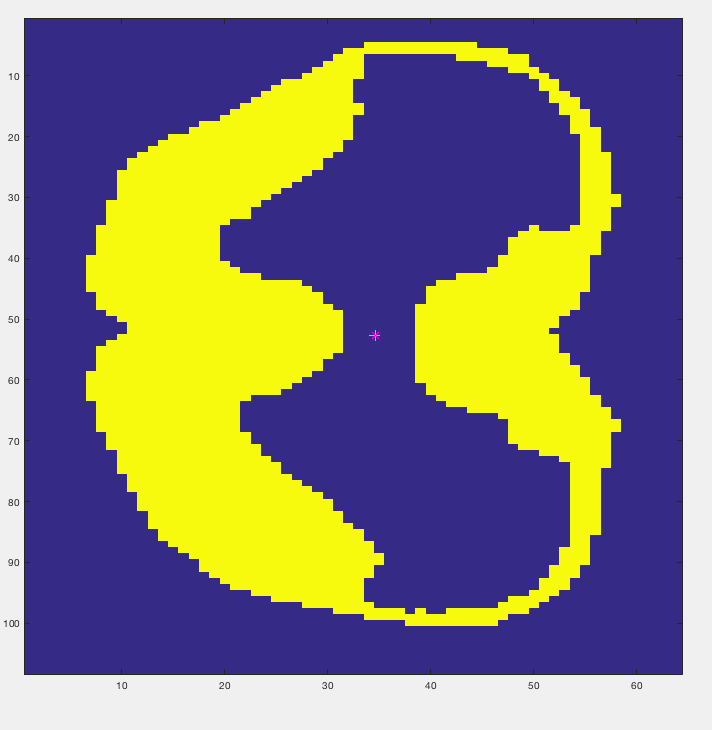
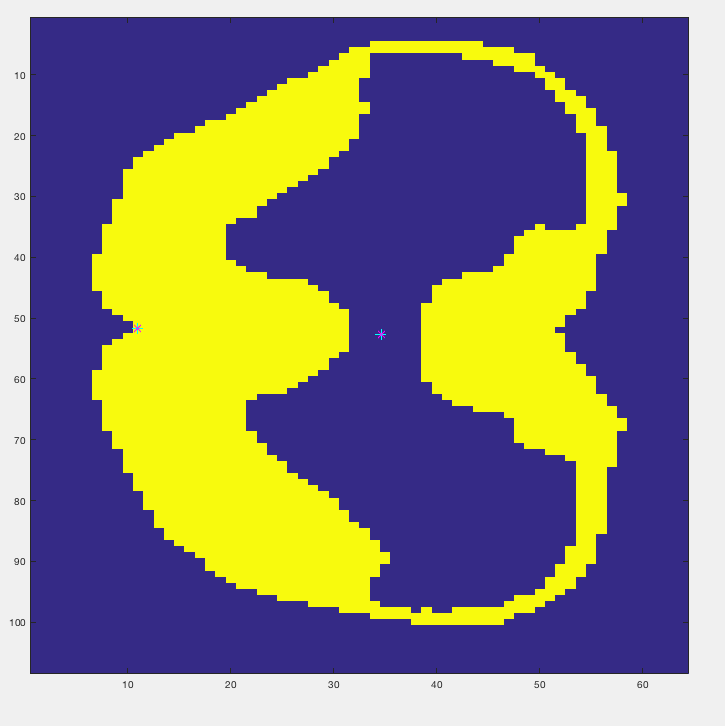
scatlas_transform_to_common_space.m: Estimate a 2D rigid transformation in order to put the original(axon density) maps into a common space, centered at Label #1 and oriented such that the line defined by Label #1 and Label #2 is vertical. Apply transformation to axon density map. Loop across subject and levels.
-
scatlas_linear_bias_correction.m: Due to the limited spatial resolution, the blurry appearance of the images induces bias in the estimation of the myelin+axon segmentation. Based on high-resolution SEM data, we estimate the bias introduced by the automatic axon+myelin segmentation.
-
scatlas_apply_correction.m: Apply the correction factors estimated in the previous step on the MVF, AVF and g-ratio maps.
-
scatlas_generate_template.m: Create average 2D template based on the WM masks, using antsmultivariateTemplateConstrusction2.sh. QC figures are generated at the root of all level folders (qc_template_*.gif).
-
scatlas_apply_warp.m: Apply the rigid transformation + warping fields to all metrics maps and generate spatial statistics (mean, STD). Note that the output volume is 4d in shape, but the 3rd dimension (corresponding to z) is a singleton to anticipate future concatenation (done in later scripts). Outputs are:
Volume4D.nii.gz(Mean across samples) andVolume4D_std.nii.gz(STD). -
scatlas_symmetrize_and_clean_template.m: This script takes the
Volume4D.nii.gzandVolume4D_std.nii.gzfiles of each level as inputs and (i) uses the left-right flips to symmetrize the output (the average is computed between the template and its flipped version); (ii) cleans the template by only keeping the spinal cord (i.e. white + gray matter) and removing the outer content. Outputs are:Volume4D_sym_cleaned.nii.gzandVolume4D_sym_std_cleaned.nii.gz -
scatlas_concatenate_all_levels.m: Generates 3D volumes of each metric across all levels, as well as cord and WM masks, and save them under a separate folder "AtlasRat/".
-
scatlas_create_spinal_levels.m: Create file with spinal levels.
-
scatlas_create_package.m: Copy documentation into output atlas folder and zip the folder for convenient upload to web server (e.g. OSF).
-
scatlas_create_mirror_image.m: Digitalization and symmetrization of an existing atlas. Here, we used the rat spinal cord atlas from Watson et al.: https://www.sciencedirect.com/science/article/pii/B9780123742476500195?via%3Dihub
-
scatlas_atlas_fix_tract_interface.m: In the current implementation of
scatlas_create_mirror_image.m, there are issues at tract interfaces, i.e.: the tracts are summed at the interface and/or there are null pixels. This creates subsequent issues in the pipeline. This script fixes that problem by applying a median filter, which effectively removes spurious pixels at interface. -
scatlas_register_atlas_to_template.m: Register the digitized atlas to the created rat template.
The digitized and registered Watson atlas is available here.
- Metrics extraction: Extract metrics within tracts defined by the atlas. 1) Creates an image showing a metric with an overlay of the atlas, where each tract is shown with a different color. 2) Extracts metrics. 3) Generate violin plot form and stats.
scatlas_extract_metrics.m
Before running the script, add to path the violin function that can be downloaded here: https://www.mathworks.com/matlabcentral/fileexchange/45134-violin-plot
ADD PIPELINE OVERVIEW FIGURE HERE
To generate figures with colormaps for each metric from a 'Volume4D.nii.gz' template, you can use the following script:
generate_metrics_figures.m
If you use this work in your research, please cite it as follows:
Ariane Saliani, Aldo Zaimi, Harris Nami, Tanguy Duval, Nikola Stikov, Julien Cohen-Adad, Construction of a rat spinal cord atlas of axon morphometry, NeuroImage, Volume 202, 2019, 116156, ISSN 1053-8119, https://doi.org/10.1016/j.neuroimage.2019.116156.
Copyright (c) 2017 NeuroPoly (Polytechnique Montreal)
The MIT License (MIT)
Copyright (c) 2017 NeuroPoly, École Polytechnique, Université de Montréal
Permission is hereby granted, free of charge, to any person obtaining a copy of this software and associated documentation files (the “Software”), to deal in the Software without restriction, including without limitation the rights to use, copy, modify, merge, publish, distribute, sublicense, and/or sell copies of the Software, and to permit persons to whom the Software is furnished to do so, subject to the following conditions:
The above copyright notice and this permission notice shall be included in all copies or substantial portions of the Software.
THE SOFTWARE IS PROVIDED “AS IS”, WITHOUT WARRANTY OF ANY KIND, EXPRESS OR IMPLIED, INCLUDING BUT NOT LIMITED TO THE WARRANTIES OF MERCHANTABILITY, FITNESS FOR A PARTICULAR PURPOSE AND NONINFRINGEMENT. IN NO EVENT SHALL THE AUTHORS OR COPYRIGHT HOLDERS BE LIABLE FOR ANY CLAIM, DAMAGES OR OTHER LIABILITY, WHETHER IN AN ACTION OF CONTRACT, TORT OR OTHERWISE, ARISING FROM, OUT OF OR IN CONNECTION WITH THE SOFTWARE OR THE USE OR OTHER DEALINGS IN THE SOFTWARE.
Julien Cohen-Adad, Tanguy Duval, Harris Nami, Ariane Saliani, Aldo Zaimi.


