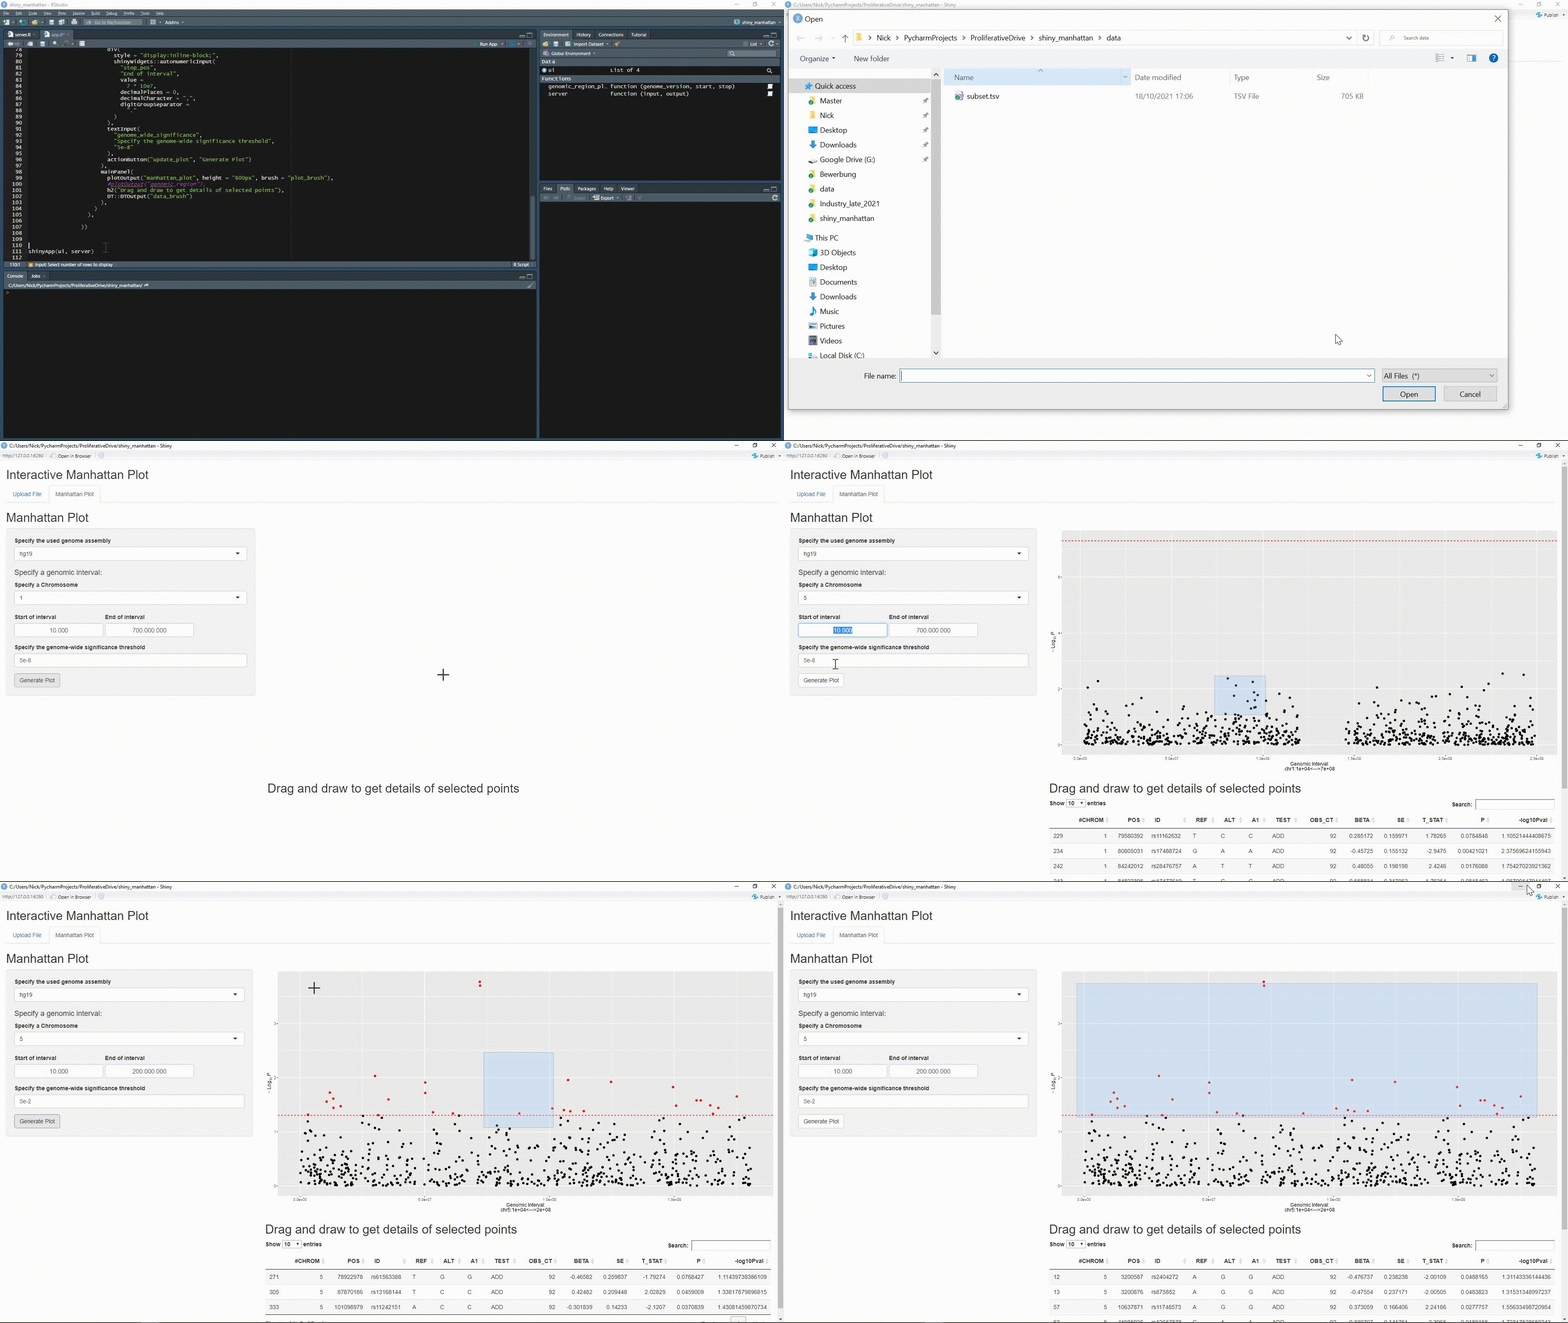
This is a simple Shiny App, which can be used to interactively create and investigate a Manhattan Plot.
To run the Shiny App, you simply have to clone the repository and execute the contents of app.R.
Then you can upload a table with the data you want to visualize.
In the future, I plan to add a track which shows the genes in the specified genomic interval.
