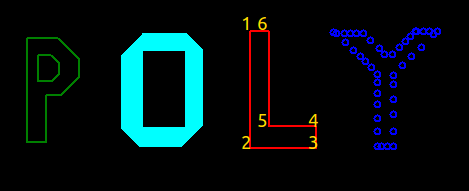
PolyView is a free and open source cross-platform program designed to quickly load, view, and edit multiple files containing polygons. It can zoom and pan, show polygons as edges, points, and filled, display text labels, print the coordinates of vertices and measure distances, change the order in which polygons are displayed, choose which polygons to show, etc.
PolyView can add, delete, move, and transform polygons, vertices, edges, and text labels. It can also cut polygons to a box.
This program can overlay images and polygons, if each image has a plain-text metadata file describing how to place the image relative to the polygons. It can plot scatter points and colorize grayscale images.
These features are explained in detail further down this document.
This software is available for Linux, OSX, and Microsoft Windows. It
can be installed in user's home directory using conda, with
no administrative rights.
First install conda from:
https://docs.conda.io/en/latest/miniconda.html
On Linux and OSX, make the fetched installation file executable and run it, such as:
chmod u+x ./Miniconda3-latest-Linux-x86_64.sh
./Miniconda3-latest-Linux-x86_64.sh
Use the suggested:
$HOME/miniconda3
directory for installation. If prompted to set up your shell and restart it, do so.
On Windows, run the installer by double-clicking on it. When finished, launch the "Anaconda PowerShell Prompt" from the "Start" menu.
Install PolyView on all platforms as:
conda create -c oleg-alexandrov -c conda-forge -n polyview polyview=1.1
This will take a while to run and will download Qt and other supporting libraries.
This program will be installed for Linux and OSX in:
$HOME/miniconda3/envs/polyview/bin/polyview
and can be run with this command. On Windows, first set in the Anaconda PowerShell the value:
$Env:QT_PLUGIN_PATH = "C:\Users\UserName\Miniconda3\envs\polyview\Library\plugins"
and then run it from that shell as:
C:\Users\UserName\Miniconda3\envs\polyview\bin\polyview.exe
Replace UserName and the drive letter with specific values for your system.
See instructions further down for how to compile PolyView.
PolyView is available under the MIT license and can be used for any purpose, academic or commercial.
PolyView was inspired by XGRAPH (http://www.xgraph.org/). The latter is a general purpose data plotter and has a lot of features PolyView lacks. PolyView has extra features for viewing and editing polygons.
PolyView is (as of 2007) more responsive for polygons with very many vertices, and it can handle zooming to small regions of polygons with large floating point vertex coordinates without overflowing and showing incorrect results. Credit for responsiveness goes to Qt, and issues with overflow required careful handling.
PolyView can place images alongside polygons, with desired position and scale.
Lastly, PolyView is open-source and under a liberal license, and can be improved in a collaborative manner.
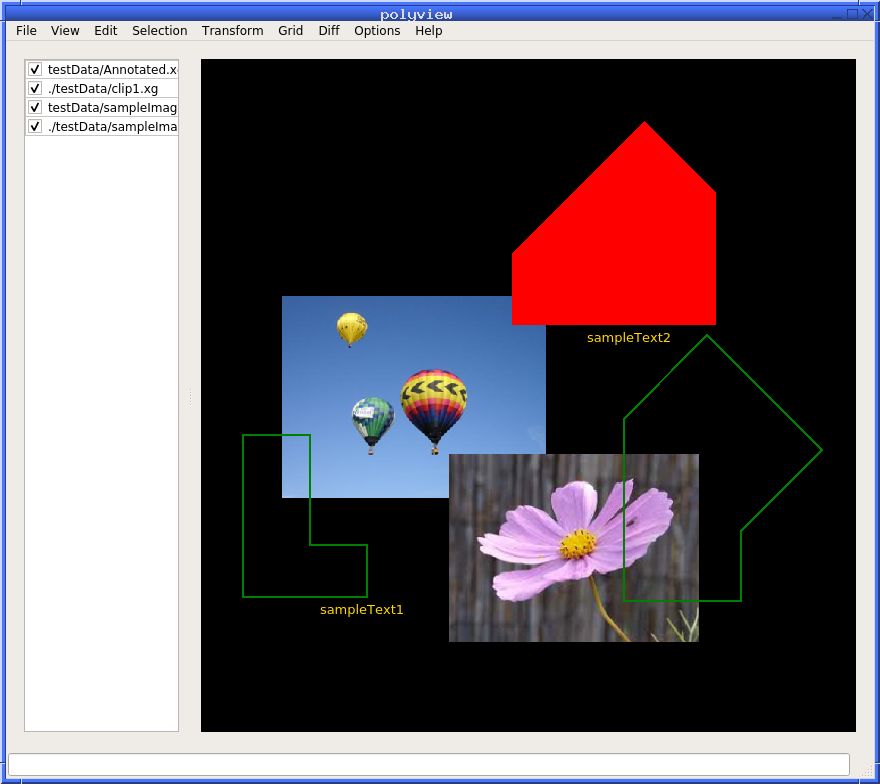
An illustration of PolyView showing overlayed polygons and images.
PolyView uses the XGRAPH file format, in which the x and y coordinates of each polygon are stored as two columns in a plain text file followed by the "NEXT" statement. Here is a sample polygon file storing a rectangle and a triangle.
color = red
6.5 5.0
7.2 5.0
7.2 7.0
6.5 7.0
6.5 5.0
NEXT
color = green
8.0 3.0
9.0 3.0
8.0 4.0
8.0 3.0
NEXT
anno 7.0 5.5 text label
Polygon vertices are stored in double precision.
Notice that the first vertex of each polygon is repeated again before the "NEXT" statement, to signal to the viewer that the polygon is closed. PolyView can also display polygonal lines, in addition to polygons, when the last vertex need not equal the first one. The last line above shows how to place a text label, with its coordinates and text.
PolyView can overlay images and polygons. The following image types are supported: JPG, PNG, GIF, TIF, BMP, and XPM.
For each image, for example, named image.jpg, there must
exist an image.txt metadata file having four numbers, which are the
coordinates of the center of the lower-left image pixel and
pixel's width and height, in the coordinate system of the
polygons. For example, if desired to place an image so that its
lower-left corner is at coordinates (10, 20), and each pixel is 3
units long and wide in polygon coordinates, then this file must have
the entries: 10 20 3 3.
This allows each image to be placed and scaled independently.
Grayscale images can be displayed with a built-in colormap (similar to Matlab's
jet) with the command line option -cm. By default, black is mapped to 0
and white is mapped to 1. The user can define a color scale with the option -cs 0 0.5.
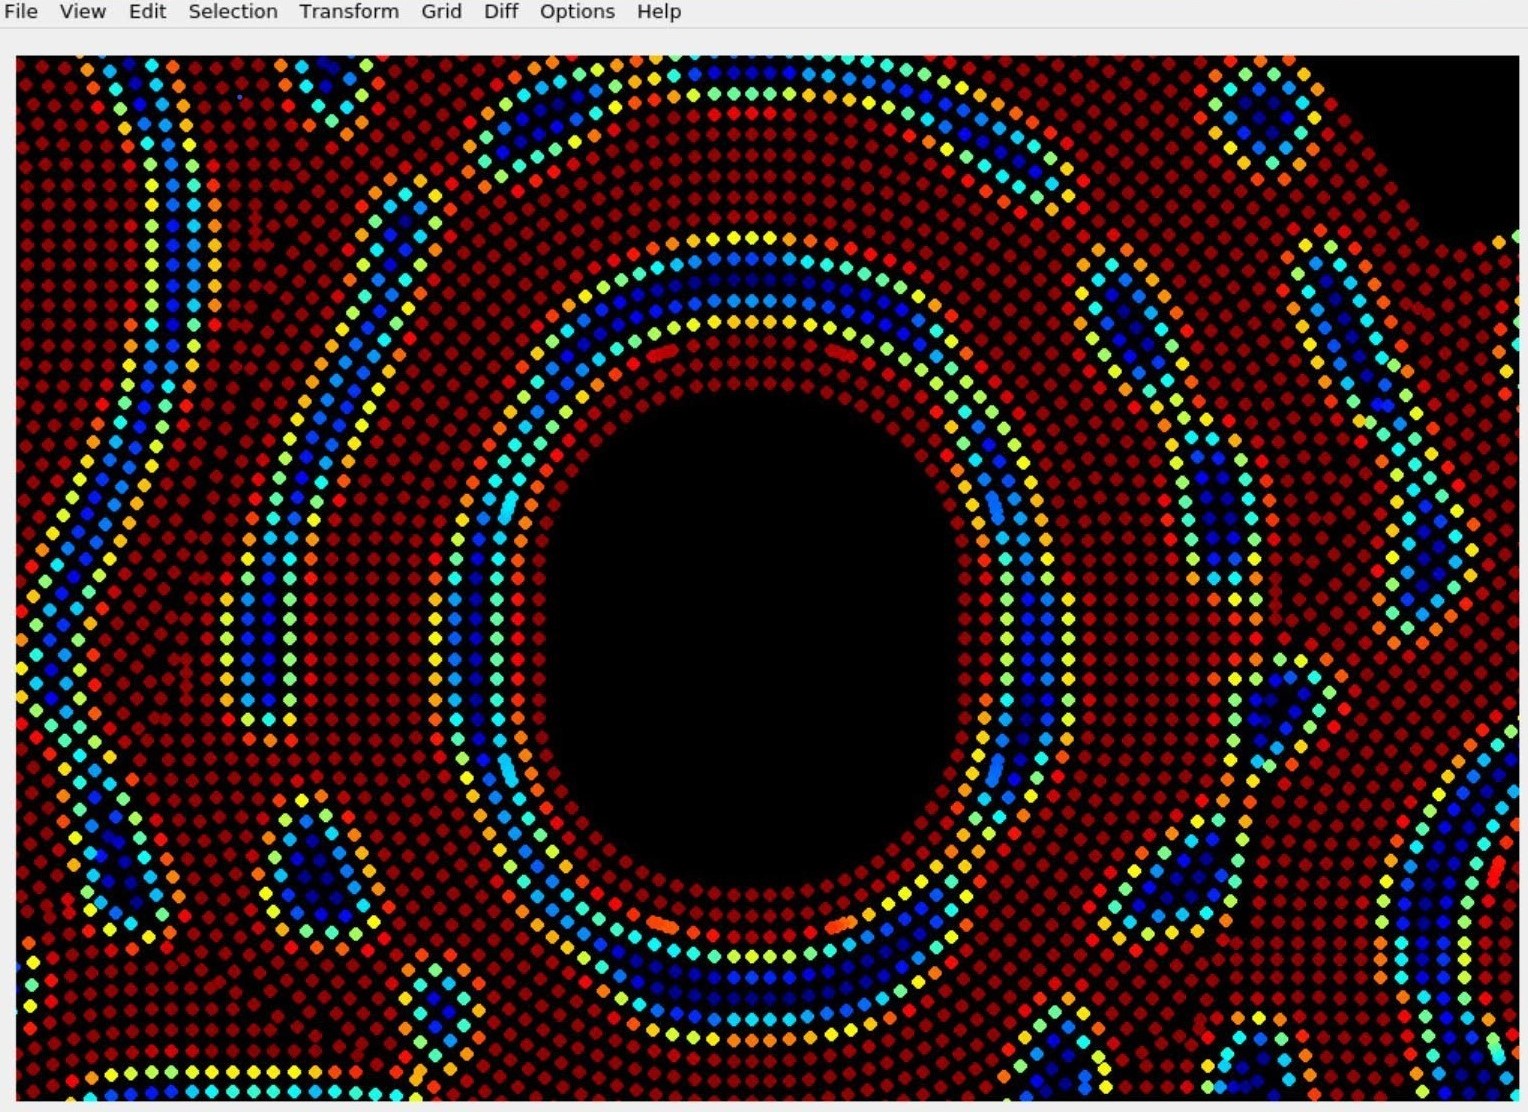
PolyView can plot scattered data with a builtin colormap and a user-defined
color scale. This mode is enabled by the command line option -sa or
-scatterAnno Such data should be provided in annotation format, such as: "anno
x1 y1 value1".
Example: data.txt
anno 10.5 10.5 0.2
anno 10.5 20.4 0.5
anno 20.2 20.4 0.8
By default, a dynamic color scale is used. The color scale is adjusted to the
maximum and minimum value inside the current view. A fixed color scale can be
set with the command line option -cs 0 0.5 before the file name.
Example invocation:
polyview -sa -ha -cs 0 1 data.txt
This will produce the following plot:
The left mouse button snaps to the closest polygon vertex and prints its coordinates in the terminal used to start PolyView. A subsequent click also prints the distance from the previous vertex to the current one. The middle mouse button prints the coordinates of where the mouse clicked, without snapping to the closest vertex. Dragging the mouse from lower-left to upper-right zooms in, and doing it in reverse zooms out. Dragging the mouse while keeping the Control key pressed creates a highlight which can be used to cut the polygons to the highlight or to paste/move/delete them.
Panning is accomplished by using the arrow keys, zooming is done with the mouse wheel and the +/- keys. Many other actions are bound to keyboard keys, as can be seen when invoking them from the menu.
Many GUI operations (such as zoom) echo their action as a command in the terminal. That command can be pasted in the command box at the bottom of the PolyView GUI to reproduce the original operation. This provides a basic level of scripting and reproducibility.
- Load a polygon file in addition to existing files
- Save the polygons as one file
- Save the polygons as individual files
- Overwrite the existing polygons
- Choose which files to hide/show
- Zoom and pan
- Reset the view to contain all polygons with a small padding
- Change the order in which the polygons are displayed
- Sequential display of objects, used to display objects one at a time.
- Show/hide annotations (text labels)
- Show the polygons filled with color
- Show the vertices only (no edges)
- Show the index of each vertex or polygon
- Show the layer ids (if present)
- Undo and redo
- Create a polygon with integer vertices and edge angles multiple of 45 degrees
- Enforce integer vertices and edge angles multiple of 45 degrees
- Create a polygon with arbitrary angles
- Translate/rotate/scale/transform selected polygons
- Reverse orientation of selected polygons
- Create a highlight (the polygons in the highlight are automatically selected and copied to a buffer)
- Cut the polygons to the current highlight
- Delete the selected polygons
- Paste the selected polygons
- Move the selected polygons (use Shift-Mouse)
- Deselect all polygons and delete all highlights
- Translate/rotate/scale/transform selected polygons
- Show/hide the grid
- Enforce that all polygon edges have angles multiple of 45 degrees and snap the vertices to the grid
- Set the grid size
- Set the grid line width
- Set the grid color
- Change the colors of polygons so that polygons from different files have different colors
- Enter diff mode (a mode in which two similar polygon files can be compared)
- Show the next/previous difference between given two given polygon files (starting with the largest difference)
- Set the line width of polygon edges
- Set the background color
- Show and save a mark at the current point
- Create a polygon with integer vertices and edge angles multiple of 45 degrees
- Enforce integer vertices and edge angles multiple of 45 degrees
- Create a polygon with arbitrary angles
- Delete the polygon at mouse cursor
- Enter move polygons mode (use Shift-Mouse to move a polygon; if some polygons are selected using a highlight, then all selected polygons will be moved)
- Enter move vertices mode (use Shift-Mouse to move a vertex)
- Enter move edges mode (use Shift-Mouse to move an edge)
- Insert a vertex on the edge closest to the mouse cursor
- Delete the vertex closest to the mouse cursor
- Copy the polygon closest to the mouse cursor
- Paste the polygon closest to the mouse cursor
- Reverse the orientation of the polygon closest to the mouse cursor
- Insert annotation (text label)
- Delete annotation (text label)
- Mark acute angles (mark polygon vertices where inner or outer angle is less than 90 degrees)
- Align mode (a mode in which, given two polygon files, the second polygon file is kept fixed, while the first one can be interactively translated using Shift-Mouse and rotated/flipped from the right-click menu until it aligns to the second one).
PolyView will open simultaneously all polygon and image files supplied as inputs on the command line. Example:
polyview poly.xg image.png
Various command line options can modify how the polygons, points, and images are displayed.
-h | -helpShow the available command line options.-geo | -geometry(width x height) The window size in pixels (for example, 800x800).-bg | -backgroundColor(color) Color of the background (the default is black).-grid(on or off) Turn on/off the grid display.-gridSize(integer) Grid size in units of geometry.-gridWidth(integer) Grid width in pixels.-gridColor(color) Grid color.-panelRatio(default = 0.2) Ratio of width of the left panel showing the file names to window width. If set to zero, it will hide that panel.
-c | -color(color) All polygons after this option will show up in the given color (the default is to use the colors specified in the polygon files).-nc | -noColorOverrideAll polygons after this option will show up in the colors specified in the file.-lw | -lineWidth(default = 1) All polygons after this option will show up with given line width.
-cp | -closedPolyAll polygons after this option will show up as closed (the last vertex is connected to the first one).-ncp | -nonClosedPolyInterpret the polygons after this option as polygonal lines (the last vertex is not connected to the first one).-f | -filledPolyAll polygons after this option will show up as filled.-nf | -nonFilledPolyAll polygons after this option will show up as not filled.-cw | -clockwisePolyPolygons oriented clockwise are assumed to have positive area.-tr | -transparency(default = 0.5) Options: [0-1]. Transparency level for filled polygons).
-p | -pointsAll polygons after this option will show up as vertices rather than edges (a subsequent -p option undoes this behavior).-sh | -shape(default = 0) Options: x, +, o, s, t. Defines shape of the points in point mode display.-si | -size(default = 3). Options: [1-8]. Defines size of the points in point mode display.
-fs | -fontSize(integer) The text font size in pixels.-ha | -hideAnnoDo not show annotations in file.-sa | -scatterAnnoPlot annotation values as scattered points.-cs | -colorScale(min_val max_val) Fixed color scale for scattered plot.
-cm | -colorMapDisplay grayscale image with built in colored map.-cs | -colorScale(min_val max_val) Color scale for the grayscale image Default: 0->black, 1->white.
PolyView is written in C++. It was successfully compiled on Linux with g++, on OSX with clang, and on Windows with Visual Studio. It was written with portability in mind and it should be possible to build it on any platform and compiler.
To compile locally, on Linux and macOS, create a conda environment having the needed dependencies:
conda create -n polyview_dev qt=5.9.7
This should install the dependencies in:
$HOME/miniconda3/envs/polyview_dev
Activate that environment with:
conda activate polyview_dev
On MacOS, run:
base=$HOME/miniconda3/envs/polyview_dev
${base}/bin/qmake \
  polyview.pro
make -j 10
make install INSTALL_ROOT=$(pwd)
While on Linux, adjust this as follows:
base=$HOME/miniconda3/envs/polyview_dev
${base}/bin/qmake \
  QMAKE_CXXFLAGS="-I${base}/include/qt -I${base}/include -I/usr/include" \
  QMAKE_LFLAGS="-L/lib64 -Wl,-rpath-link -Wl,${base}/lib -Wl,-rpath-link -Wl,/lib64" \
  polyview.pro
make -j 10
make install INSTALL_ROOT=$(pwd)
The extra options above are to help the compiler find its dependencies.
This should create the polyview program in the bin subdirectory.
Polyview can be compiled with openMP for run time performance, on supported platforms. Provide this option to qmake build:
qmake CONFIG+=polyview_use_openmp
This will produce a packaged build, that can be uploaded to the cloud and later fetched with conda, as described at the beginning of this document.
Fetch the source code, go to the "PolyView" directory, and run:
conda create --name polyview
conda activate polyview
conda install conda-build
conda build .
This will produce a packaged build. To keep the development environment,
so the code can be edited and recompiled, pass to conda build
the flags --dirty --keep-old-work. See also the
conda build documentation.
On Windows, Visual Studio is needed. On OSX, XCode may be necessary. On Linux, the compiler is fetched by conda.
Oleg Alexandrov (oleg.alexandrov@gmail.com), Bayram Yenikaya
Many thanks to Anish Rasal Raj for porting PolyView to Qt 5.


