Gold Sponsor: Greenzie
PlotJuggler 3.6
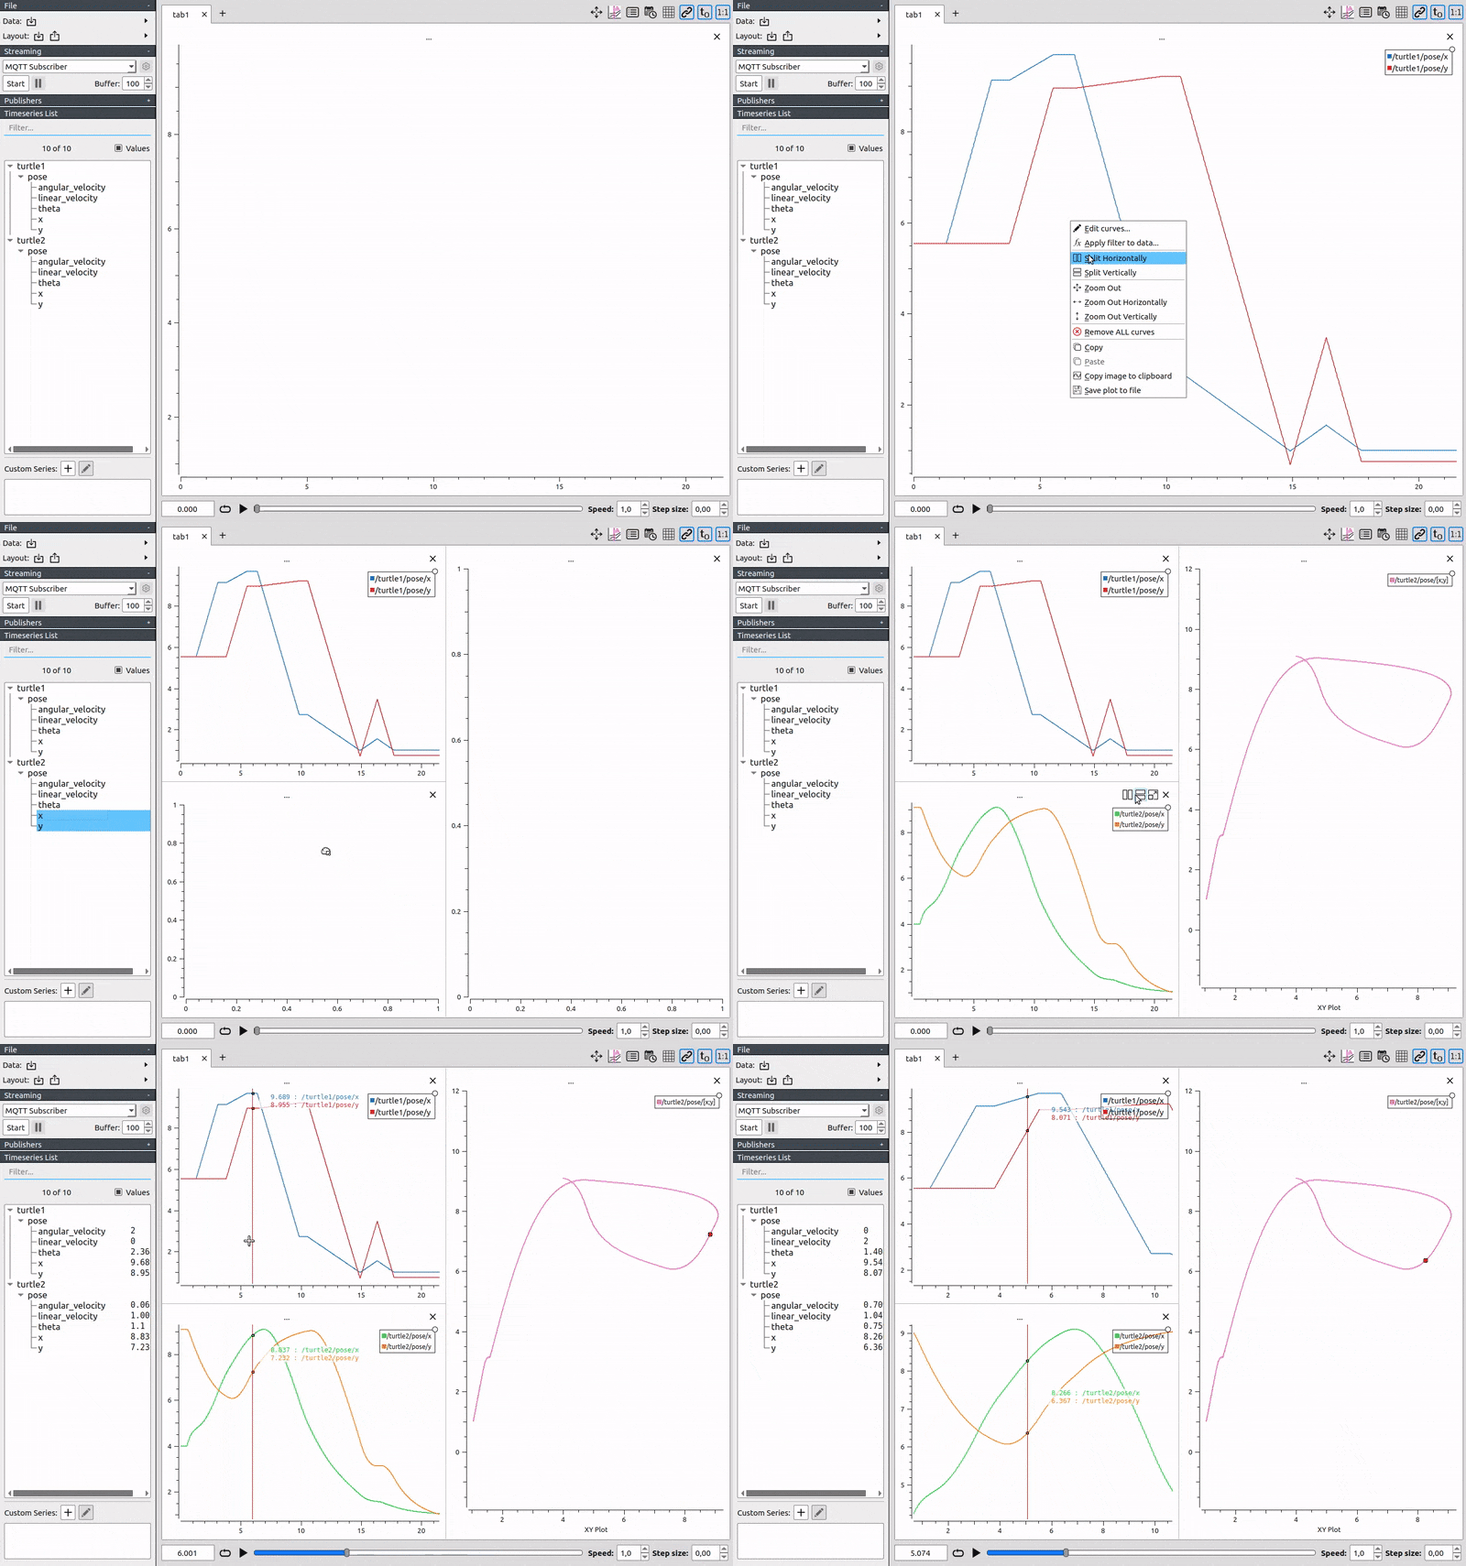
PlotJuggler is a tool to visualize time series that is fast, powerful and intuitive.
Noteworthy features:
- Simple Drag & Drop user interface.
- Load data from file.
- Connect to live streaming of data.
- Save the visualization layout and configurations to re-use them later.
- Fast OpenGL visualization.
- Can handle thousands of timeseries and millions of data points.
- Transform your data using a simple editor: derivative, moving average, integral, etc…
- PlotJuggler can be easily extended using plugins.
Data sources (file and streaming)
- Load CSV files.
- Load ULog (PX4).
- Subscribe to many different streaming sources: MQTT, Websockets, ZeroMQ, UDP, etc.
- Understands data formats such as JSON, CBOR, BSON, Message Pack, etc.
- Well integrated with ROS: open rosbags and/or subscribe to ROS topics (both ROS1 and ROS2).
- Supports the Lab Streaming Layer, that is used by many devices.
- Easily add your custom data source and/or formats...
Transform and analyze your data
PlotJuggler makes it easy to visualize data but also to analyze it. You can manipulate your time series using a simple and extendable Transform Editor.
Alternatively, you may use the Custom Function Editor, that allows you to create Multi-input / Single-output functions using a scripting language based on Lua.
If you are not familiar with Lua, don't be afraid, you won't need more than 5 minutes to learn it ;)
Tutorials
To learn how to use PlotJuggler, check the tutorials here:
| Tutorial 1 | Tutorial 2 | Tutorial 3 |
|---|---|---|
 |
 |
 |
Supported plugins
Some plugin can be found in a different repository. The individual README files should include all the information needed to compile and use the plugin.
Please submit specific issues, Pull Requests and questions on the related Github repository:
If you want a simple example to learn how to write your own plugins, have a look at PlotJuggler/plotjuggler-sample-plugins
Installation
Binary installers
Note that these installers do not include ROS plugins.
Linux AppImage (compatible with Ubuntu 20.04 or later): PlotJuggler-3.6.0-x86_64.AppImage
Windows Installer: PlotJuggler-Windows-3.6.0-installer
Debian packages for ROS User
Install the ROS packages with:
sudo apt install ros-$ROS_DISTRO-plotjuggler-ros
To launch PlotJuggler on ROS, use the command:
rosrun plotjuggler plotjuggler
or, if are using ROS2:
ros2 run plotjuggler plotjuggler
ROS plugins are available in a separate repository: https://github.com/PlotJuggler/plotjuggler-ros-plugins
Refer to the instructions in that repository if you want to compile PJ and its ROS plugins from source.
Install with Snap
This massive file will install a version of PlotJuggler that can work with both ROS1 and ROS2.
sudo snap install plotjuggler
When launching you have two options available:
plotjuggler.rosto load the ROS1 pluginsplotjuggler.ros2to load the ROS2 plugins
In addition, the command plotjuggler is an alias to plotjuggler.ros.
If you'd prefer to alias plotjuggler.ros2 instead,
you can do so with the command sudo snap set plotjuggler ros-plugin-version=2.
Revert it simply replacing 2 with 1.
Note that this also affect the desktop launcher.
Compile from source
You can find find the detailed instructions here: COMPILE.md.
Sponsorship and commercial support
PlotJuggler required a lot of work to be developed; my goal is to build the most intuitive and powerfull tool to visualize data and timeseries.
If you find PlotJuggler useful, consider making a donation on PayPal or become a Github Sponsor.
If you need to extend any of the functionalities of PlotJuggler to cover a specific need or to parse your custom data formats, you can receive commercial support from the main author, Davide Faconti.
License
PlotJuggler is released under the Mozilla Public License Version 2.0, which allows user to develop closed-source plugins.
Please note that some third party dependencies (including Qt) use the GNU Lesser General Public License.


