In this task, we aim to calculate the product of matrices A and B with the following dimensions:
- A: MxN
- B: NxP
- C: MxP
We use 3 different approaches where the first approach is more efficient but has more limitations. The second approach is less efficient but has no limitations. The third approach is more efficient and has more limitations.
In this approach, we use one thread for each multiplication, which means we have MxP blocks per grid and N threads per block. After calculating the products, we add them using atomic addition.
- N < 1024
- M*P < Maximum number of blocks per grid (depending on the GPU model)
In this approach, we have one thread for each output element in C, which means we have MxP threads in total. In each thread, we calculate the dot product using a for loop. We use local memory in each thread for partial sums to avoid access to global memory.
- M*P < Maximum number of threads in total
In this approach, we have one block for each outer product, which means we have N blocks in total. In each block, there are MxP threads to calculate the outer product in parallel. We use shared memory to reduce the number of accesses to global memory. At the end, we sum up the outer products using atomic addition.
- M*P < 1024
- N < Maximum number of blocks per grid
- Some useful functions that were used several times are written in
helpers.cu. This file is then included in the main files. - Some lines of code are embraced between
//! for debugging [begin]and//! for debugging [end]. These lines can be uncommented for debugging purposes.
We use nvcc to compile our CUDA programs. In order to test the functionality of our codes, we use matrices A(3x1000) and B(1000x4) so that the output C is 3x4.
We can use nvprof to profile the process of running. The results on my own GPU (NVIDIA GeForce MX450) is as follows:
==38049== NVPROF is profiling process 38049, command: ./opt
Test PASSED
==38049== Profiling application: ./opt
==38049== Profiling result:
            Type  Time(%)      Time     Calls       Avg       Min       Max  Name
 GPU activities:   84.58%  21.408us         1  21.408us  21.408us  21.408us  matmul_optimum(float*, float*, float*, int, int, int)
                   10.49%  2.6560us         3     885ns     320ns  1.1840us  [CUDA memcpy HtoD]
                    4.93%  1.2480us         1  1.2480us  1.2480us  1.2480us  [CUDA memcpy DtoH]
      API calls:   99.25%  39.574ms         3  13.191ms  2.4580us  39.568ms  cudaMalloc
                    0.28%  111.33us         1  111.33us  111.33us  111.33us  cudaLaunchKernel
                    0.27%  105.94us       114     929ns      90ns  40.985us  cuDeviceGetAttribute
                    0.14%  55.164us         4  13.791us  6.4500us  29.215us  cudaMemcpy
                    0.04%  15.739us         1  15.739us  15.739us  15.739us  cuDeviceGetName
                    0.01%  5.1760us         1  5.1760us  5.1760us  5.1760us  cuDeviceGetPCIBusId
                    0.01%  2.9650us         1  2.9650us  2.9650us  2.9650us  cuDeviceTotalMem
                    0.01%  2.0610us         3     687ns     144ns  1.7580us  cuDeviceGetCount
                    0.00%     411ns         2     205ns      86ns     325ns  cuDeviceGet
                    0.00%     178ns         1     178ns     178ns     178ns  cuModuleGetLoadingMode
0.00% 150ns 1 150ns 150ns 150ns cuDeviceGetUuid==38110== NVPROF is profiling process 38110, command: ./inner
Test PASSED
==38110== Profiling application: ./inner
==38110== Profiling result:
Type Time(%) Time Calls Avg Min Max Name
GPU activities: 99.19% 481.32us 1 481.32us 481.32us 481.32us matmul_innerprod(float*, float*, float*, int, int, int)
0.55% 2.6880us 3 896ns 352ns 1.1840us [CUDA memcpy HtoD]
0.26% 1.2490us 1 1.2490us 1.2490us 1.2490us [CUDA memcpy DtoH]
API calls: 98.18% 52.997ms 3 17.666ms 2.4380us 52.990ms cudaMalloc
0.95% 514.03us 4 128.51us 5.7650us 488.17us cudaMemcpy
0.54% 293.97us 114 2.5780us 303ns 110.72us cuDeviceGetAttribute
0.22% 117.06us 1 117.06us 117.06us 117.06us cudaLaunchKernel
0.07% 37.030us 1 37.030us 37.030us 37.030us cuDeviceGetName
0.02% 9.6450us 1 9.6450us 9.6450us 9.6450us cuDeviceTotalMem
0.01% 5.0940us 3 1.6980us 429ns 4.1630us cuDeviceGetCount
0.01% 4.7040us 1 4.7040us 4.7040us 4.7040us cuDeviceGetPCIBusId
0.00% 1.4980us 2 749ns 337ns 1.1610us cuDeviceGet
0.00% 786ns 1 786ns 786ns 786ns cuModuleGetLoadingMode
0.00% 487ns 1 487ns 487ns 487ns cuDeviceGetUuid
==38167== NVPROF is profiling process 38167, command: ./outer
Test PASSED
==38167== Profiling application: ./outer
==38167== Profiling result:
            Type  Time(%)      Time     Calls       Avg       Min       Max  Name
 GPU activities:   64.35%  7.3920us         1  7.3920us  7.3920us  7.3920us  matmul_outerprod(float*, float*, float*)
                   23.68%  2.7200us         3     906ns     352ns  1.2160us  [CUDA memcpy HtoD]
                   11.98%  1.3760us         1  1.3760us  1.3760us  1.3760us  [CUDA memcpy DtoH]
      API calls:   98.82%  41.208ms         3  13.736ms  2.5700us  41.201ms  cudaMalloc
                    0.69%  286.43us       114  2.5120us     310ns  106.58us  cuDeviceGetAttribute
                    0.26%  107.06us         1  107.06us  107.06us  107.06us  cudaLaunchKernel
                    0.09%  39.160us         1  39.160us  39.160us  39.160us  cuDeviceGetName
                    0.09%  38.401us         4  9.6000us  6.2060us  13.192us  cudaMemcpy
                    0.02%  9.1280us         1  9.1280us  9.1280us  9.1280us  cuDeviceTotalMem
                    0.01%  5.7810us         3  1.9270us     474ns  4.8000us  cuDeviceGetCount
                    0.01%  3.9580us         1  3.9580us  3.9580us  3.9580us  cuDeviceGetPCIBusId
                    0.00%  1.6180us         2     809ns     334ns  1.2840us  cuDeviceGet
                    0.00%     808ns         1     808ns     808ns     808ns  cuModuleGetLoadingMode
                    0.00%     489ns         1     489ns     489ns     489ns  cuDeviceGetUuid
In this task, we aim to implement the Bellman-Ford algorithm (which is a single source shortest path(SSSP) algorithm to find the shortest path from a source vertex to every other vertex) in CUDA using a parallel approach.
How it works: In this algorithm, assuming that we have a graph
The main idea to parallelize this algorithm is to relax all the edges in parallel in each iteration. In order to achieve this, we assign each thread to one edge in the graph. At the end of each iteration, we should synchronize all the threads.
I first tried to use __syncthreads() at the end of each iteration and call the kernel just once. But it turns out that __syncthreads() just synchronizes threads in a block, not all the threads in the grid.
Solution: To solve this challenge, we have to control the sequential part of the algorithm in the host. So we call the kernel function
I used the following struct to store the graph:
typedef struct Edge {
    int src, dst, weight;
} Edge;

typedef struct Graph {
    int V, E;
    Edge* edges;
} Graph;
This works fine until the step in which we want to copy the graph from the host to the device. If we just copy the Graph struct, the array in it (edges) doesn't get copied.
Solution: To copy a Graph struct, we must copy the edges array independently. In order to fix this problem, I used this answer in StackOverflow, in which we use a temporary pointer and use it to allocate space for the edges array in the device. Then we copy its pointer value from the host into &(graph_dev->edge) in the device. At the end, we can copy the whole array from the host (graph->edges) to the device (temporary pointer).
We don't always need to iterate bool changed that shows if any vertex's distance has been changed after each iteration. If there is no change in any of the graph's vertices, we can terminate the algorithm (and go for the last check for negative cycle).
In the data directory, there are three files:
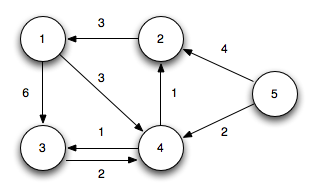
USA-road-d.CAL.gr: a huge graph with only positive edges.small graph.gr: a simple graph to test the program functionality:
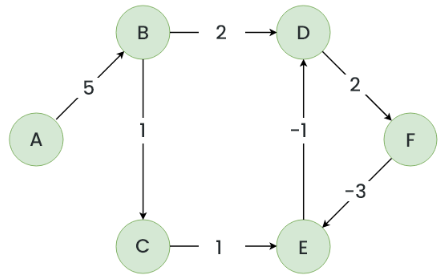
neg cycle.gr: a simple graph to test the program's ability to detect negative cycles.
- The input files conatain one-based numbering for vertices (the source vertex is
$1$ ), but we use zero-based numbering. So in the lines 110 and 111, we first decrement the inputs and then we store them. - There are some auxilary functions to print the graph and the distance array, called
print_graphandprint_distrespectively. These functions has a shorter format calledprint_graph_briefandprint_dist_briefrespectively. These two functions only prints the first and last 5 elements. - Some lines are commented by
//! for debuggingwhich can be uncommented for debugging purposes.


