A tiny CPU profiler for Java written completely in Java 17.
This is an educational sampling profiler that helps demystify profilers, but is not limited to it.
This profiler is a sampling profiler with can output method tables and
flame graphs (via d3-flame-graph).
The sampling is based on the Thread.getAllStackTraces() method, making it simple but also safepoint-biased.
The profiler should work on any platform with a JDK 17 or newer (JDK 11 version by Stefan Schnell). The usage is fairly simple:
# build it
mvn package

# run your program and print the table of methods sorted by their sample count
# and the flame graph, taking a sample every 10ms
java -javaagent:target/tiny-profiler.jar=flamegraph=flame.html ...
Example:
Profiling the included fibonacci benchmark:
> java -javaagent:target/tiny-profiler.jar=flamegraph=flames.html Fib.java 40
===== method table ======
Total samples: 54
Method                                                          Samples Percentage     On top Percentage
com.sun.tools.javac.launcher.Main.run                                53      98,15          0       0,00
com.sun.tools.javac.launcher.Main.main                               53      98,15          0       0,00
com.sun.tools.javac.launcher.Main.compile                            28      51,85          0       0,00
java.lang.reflect.Method.invoke                                      25      46,30          0       0,00
Profiling the Renaissance benchmark suite:
# download a benchmark
> test -e renaissance.jar || wget https://github.com/renaissance-benchmarks/renaissance/releases/download/v0.14.2/renaissance-gpl-0.14.2.jar -O renaissance.jar

> java -javaagent:./target/tiny-profiler.jar=flamegraph=flames.html -jar renaissance.jar dotty
...
===== method table ======
Total samples: 11217
Method                                                          Samples Percentage     On top Percentage
dotty.tools.dotc.typer.Typer.typed                                59499     530.44          2       0.02
dotty.tools.dotc.typer.Typer.typedUnadapted                       31050     276.81          7       0.06
scala.runtime.function.JProcedure1.apply                          24283     216.48         13       0.12
dotty.tools.dotc.Driver.process                                   19012     169.49          0       0.00
dotty.tools.dotc.typer.Typer.typedUnnamed$1                       18774     167.37          7       0.06
dotty.tools.dotc.typer.Typer.typedExpr                            18072     161.11          0       0.00
scala.collection.immutable.List.foreach                           16271     145.06          3       0.03
...
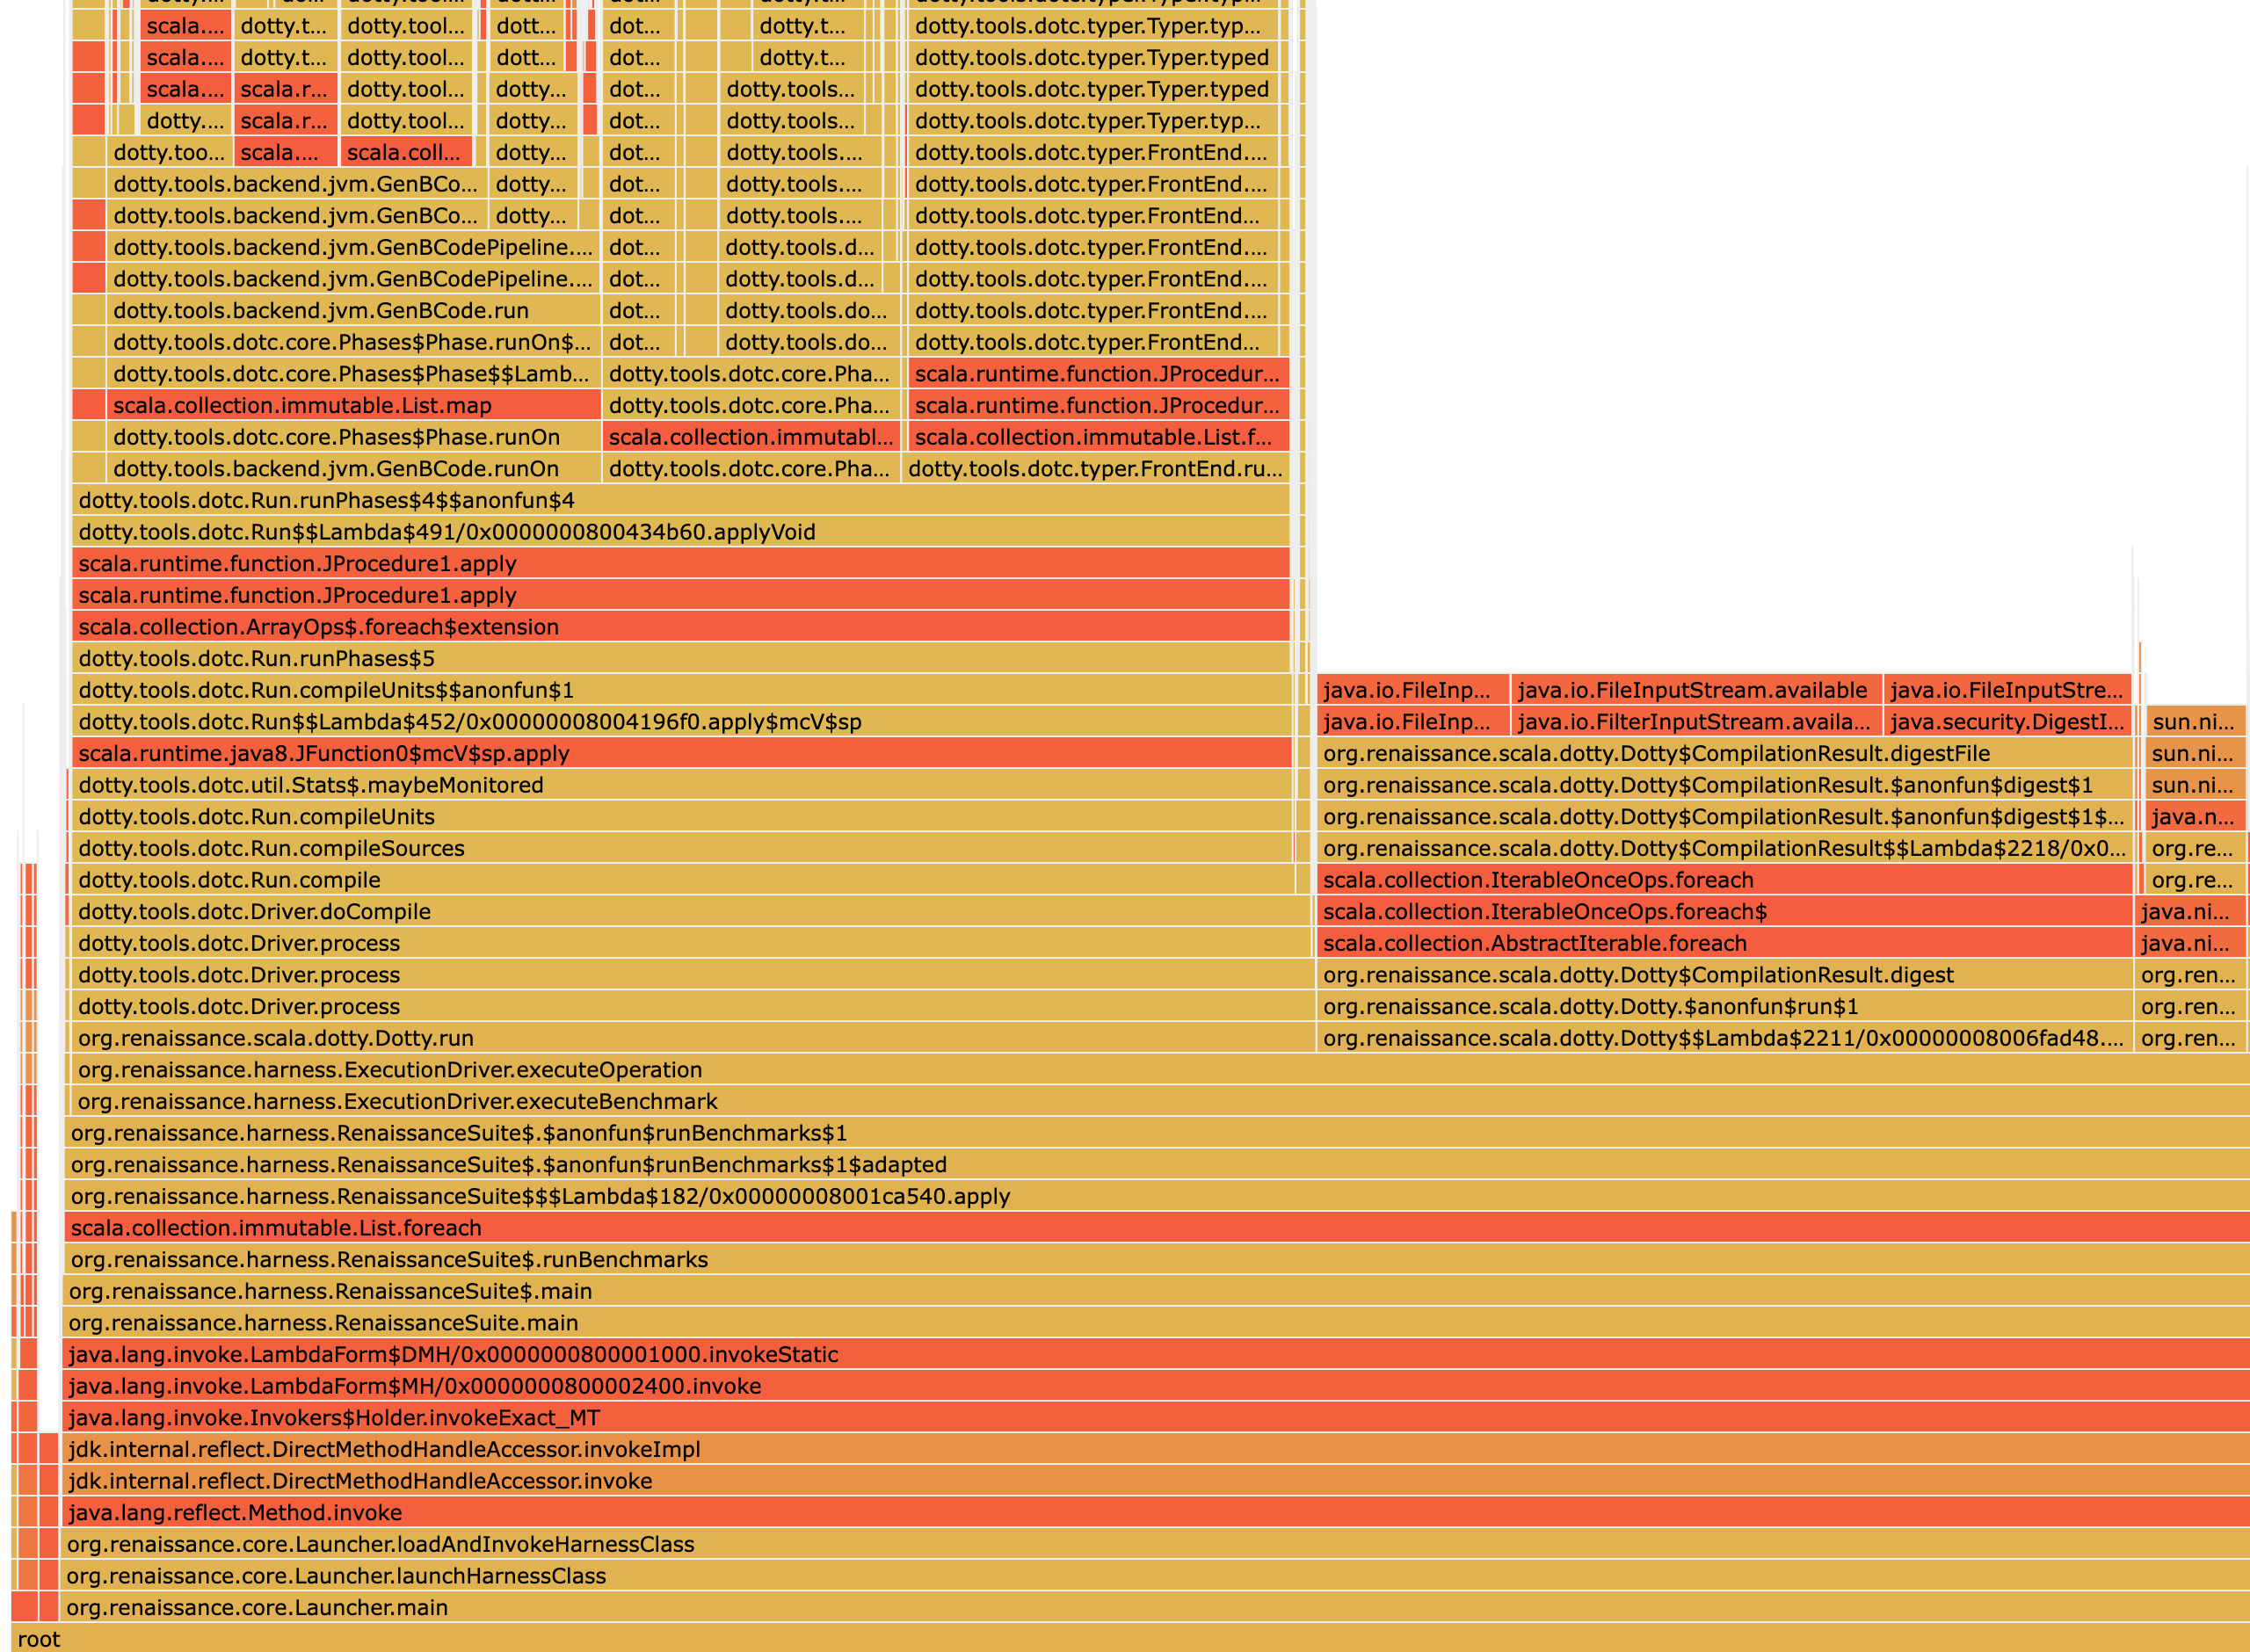
This results in the following flamegraph:
The overhead for this example is around 2% on my MacBook Pro 13" for a 10ms interval, which makes the profiler usable when you ignore the safepoint-bias.
- Main class: Entry point of the Java agent
- Options: Parses and stores the agent options
- Profiler: Contains the profiling loop
- Store: Stores and outputs the collected results
MIT, Copyright 2023 SAP SE or an SAP affiliate company, Johannes Bechberger and tiny profiler contributors
This project is a prototype of the SapMachine team at SAP SE
