Maintainer: Peter Beerli beerli@fsu.edu License: MIT license (c) 2015 Peter Beerli
popsim.py visualize population models and samples taken from such population models:
- Wright-Fisher model
- Canning exchangeable model (needs an additional parameter for offspring variance)
- Moran model
For each of the models one can specify an exponential growth rate.
The number of individuals and other parameters can be given as options: Check out all options using:
python popsim.py --help
Example calls are:
python popsim.py -m WrightFisher
python popsim.py --model Moran
python popsim.py --model WrightFisher -g 0.014
python popsim.py -m Moran  -g -0.011
python popsim.py -m Canning --offspring 1.5
python popsim.py --model Canning -o 1.5 -g 0.01
python popsim.py -size [10,10] -dpi 300 -n 50 -s 5
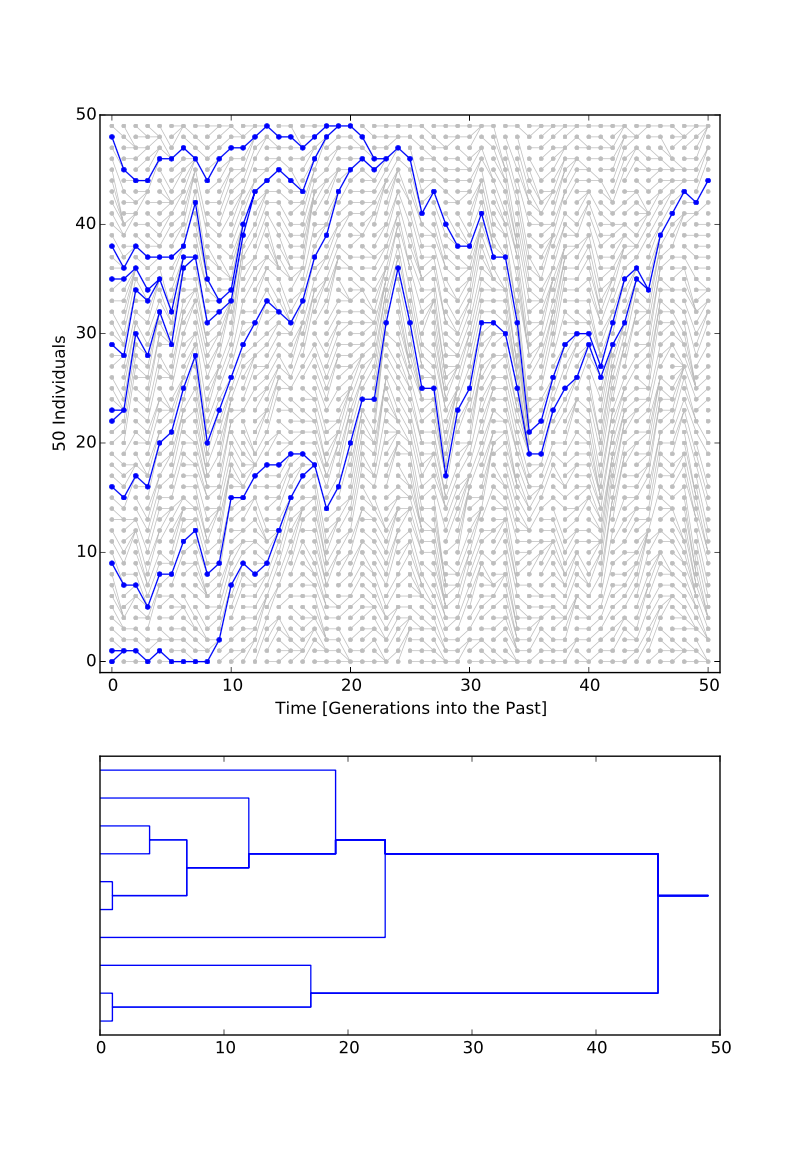
A PDF file is created with two plots on one page:
- the population history through time
- and a genealogy of the sample
The default filename is set in the DEFAULT section of the program and is wf.pdf which happens to be an ambigous name: wright-fisher, water frog, .... :-)
python popsim.py -h

usage: popsim.py [-h] [-m MODEL] [-o OFFSPRING_VARIANCE] [-n NE]
                 [-t GENERATIONS] [-r GROWTH] [-s SAMPLESIZE] [--seed SEED]
                 [-f FILENAME] [-ms MARKERSIZE] [-c COLOR] [-rat RATIO]
                 [-dpi DPI] [-size PAPERSIZE]

Population simulation for several models including exponentially growing or
shrinking

optional arguments:
  -h, --help            show this help message and exit
  -m MODEL, --model MODEL
                        set the population model, models other than
                        WRIGHTFISHER, CANNING, and MORAN will fail
  -o OFFSPRING_VARIANCE, --offspringvar OFFSPRING_VARIANCE
                        set the offspring variance, this options has only an
                        effect on the CANNING model, good values are 0.5 or
                        1.5 etc, values close to 0.0 will result in very long
                        coalescent trees, high values will result in very
                        short coalescent trees
  -n NE, --Ne NE        the effective population size today
  -t GENERATIONS, --generations GENERATIONS
                        set the number of generations to plot
  -r GROWTH, --growth GROWTH
                        set the exponential growth rate: -0.01 or 0.01 are
                        good values
  -s SAMPLESIZE, --samplesize SAMPLESIZE
                        sample size
  --seed SEED           seed for random number generator
  -f FILENAME, --filename FILENAME
                        filename for output (format is PDF)
  -ms MARKERSIZE, --markersize MARKERSIZE
                        size of marker to plot, for large Ne and large
                        generation times use a smaller value than 3.0
  -c COLOR, --color COLOR
                        color of the coalescent sample tree
  -rat RATIO, --ratio RATIO
                        Ratio between size of population plot and genealogy
                        plot, values larger than 1.0 make the genealogy plot
                        larger than the population plot
  -dpi DPI, --dpi DPI   DPI: dots per inch, None means default, perhaps this
                        should be changed for prodcution plots
  -size PAPERSIZE, --papersize PAPERSIZE
                        size of the paper, this needs to be a list of two
                        values, for example [8,11.5]
