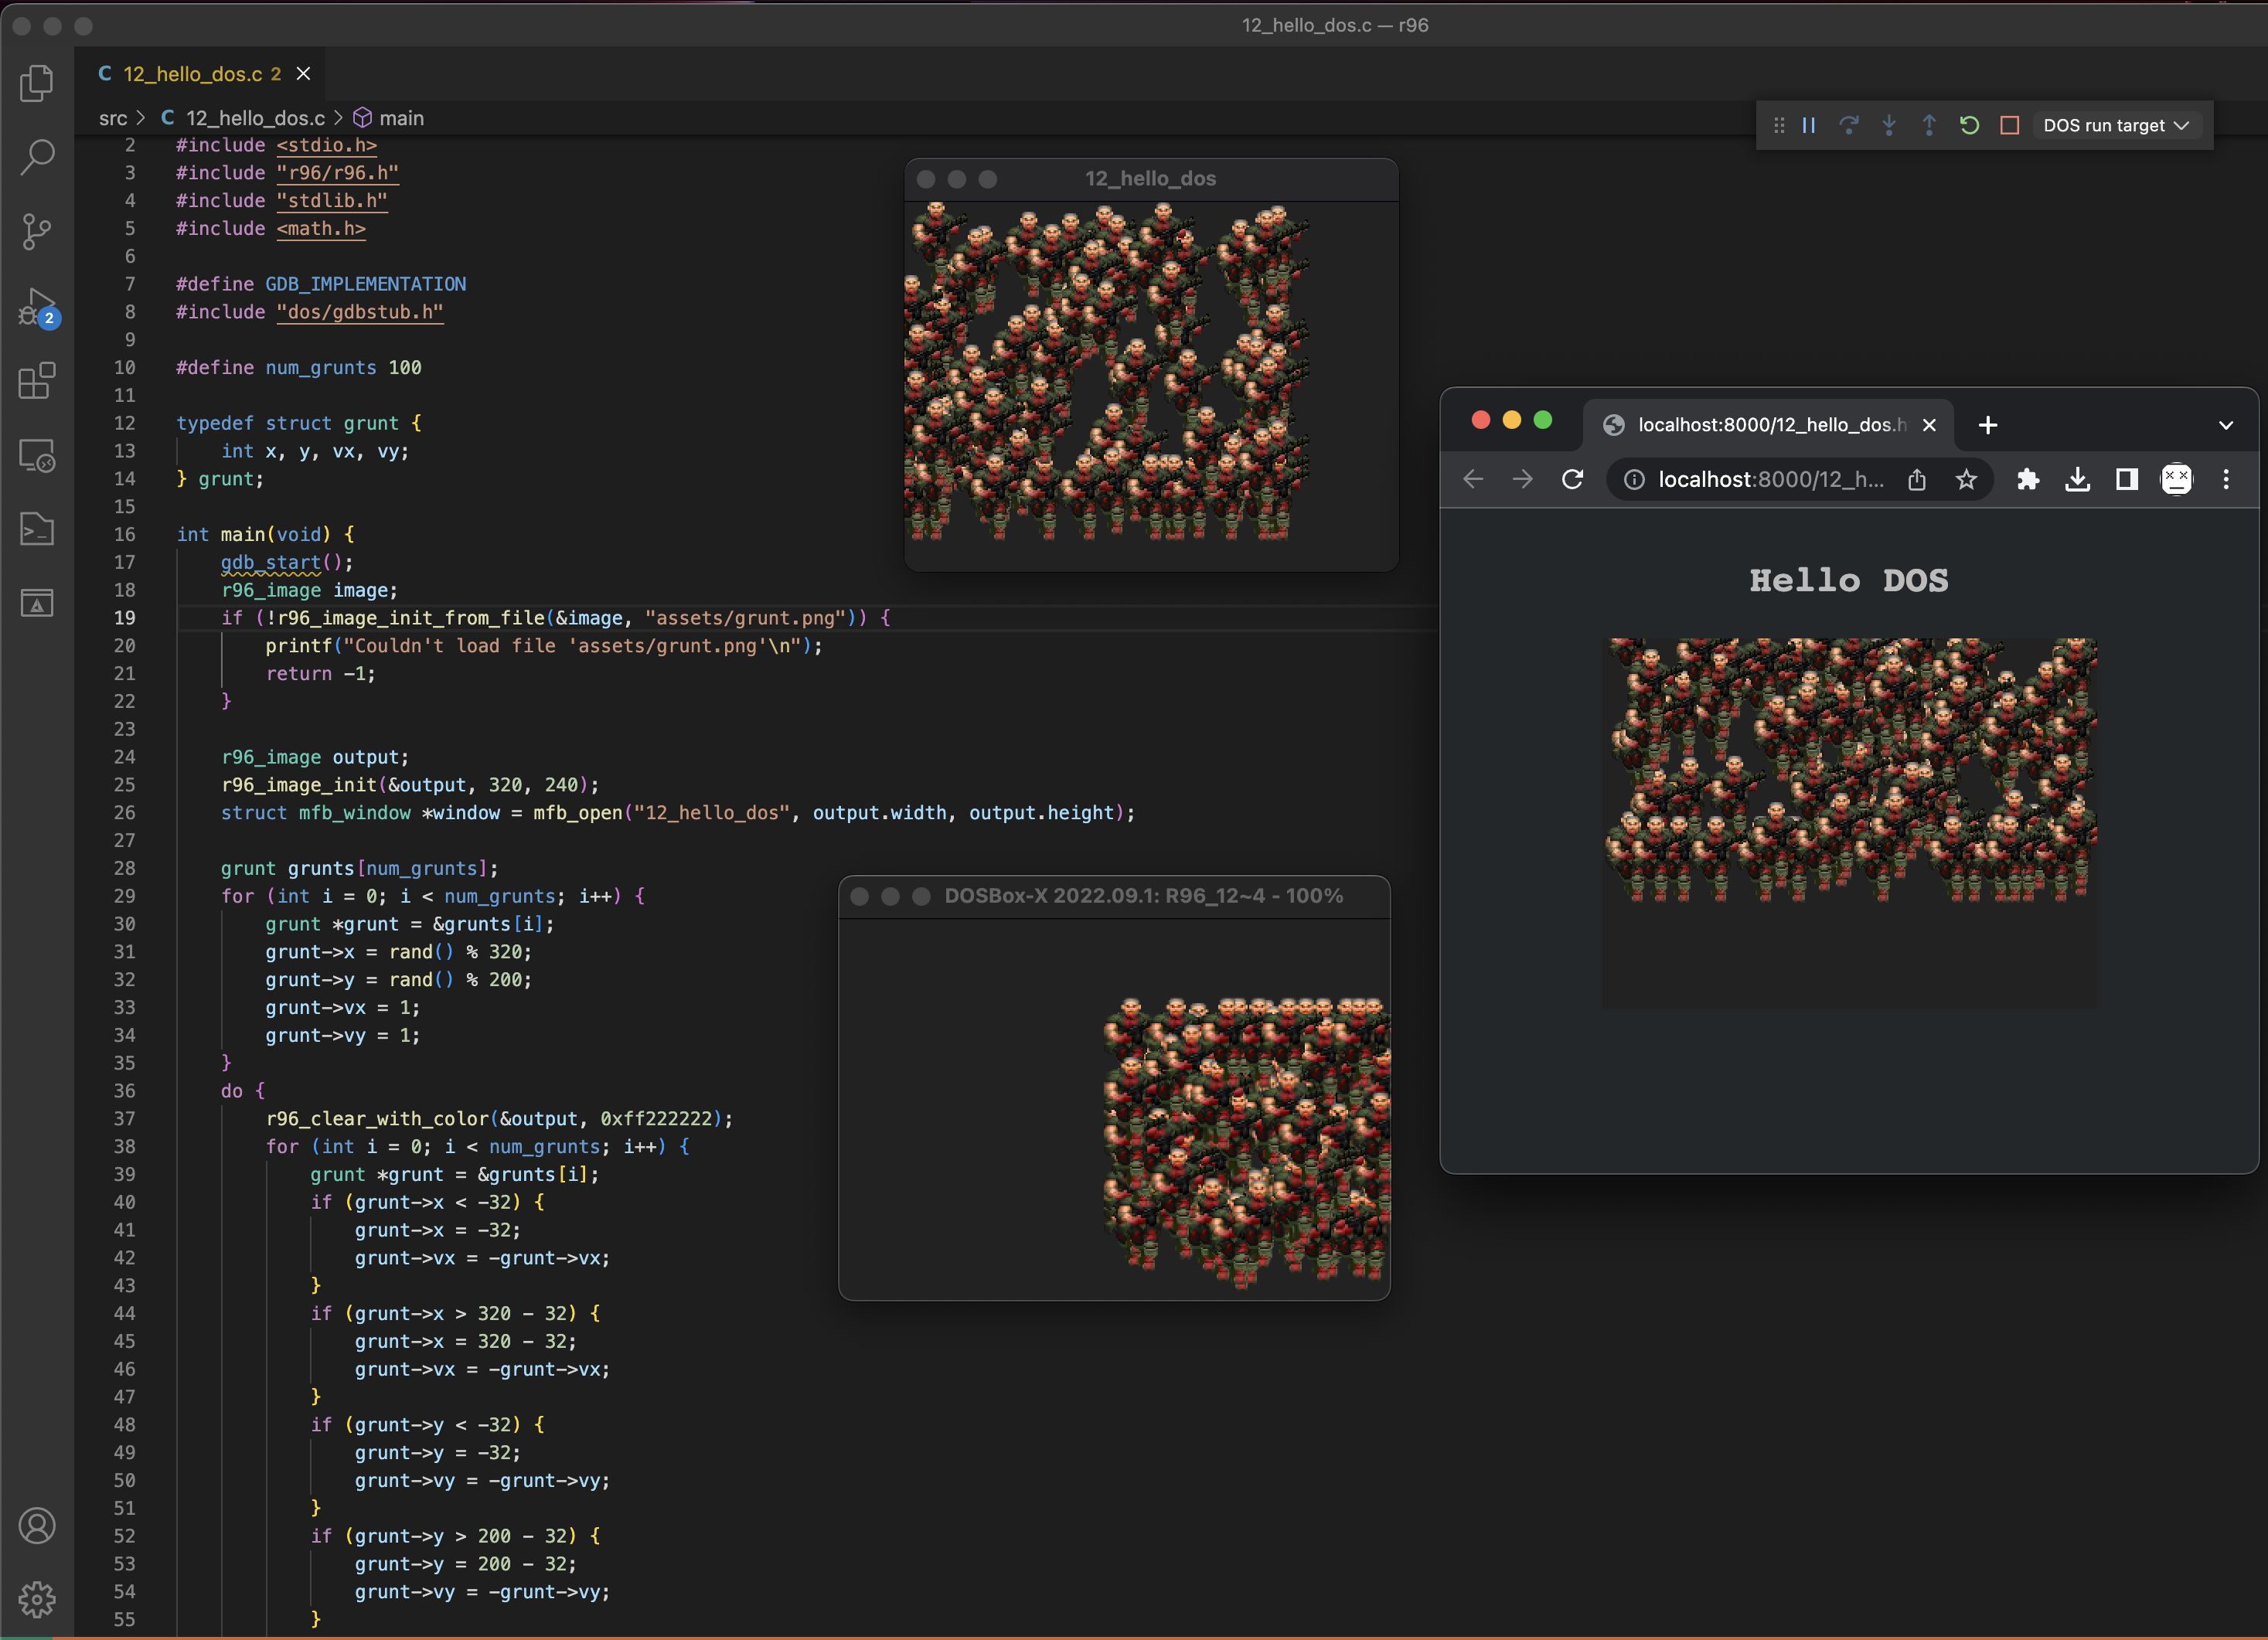
 Repository for the blog post series "Rendering like it's 1996". The series walks you through building various software rasterization techniques as used in PC games and demos of the 90ies, while using "modern" technologies.
The code is written using C99 and can be run out of the box on Windows, Linux, macOS, web browsers with WASM support, and DOS, e.g. DOSBox, FreeDOS running in VirtualBox, or actual DOS hardware with support for VESA.
The rasterization code itself is platform agnostic and should compile for any platform. The demos use a fork of MiniFB to open a window, draw pixels to it, process input events, and query a high-precision timer.
View the demos in your browser.
To compile this project for the desktop, web, and DOS, install these dependencies first:
- Visual Studio Code
- Ensure Visual Studio Code is available on the command line via the
codecommand. This is the default on Windows and Linux. On macOS, pressCMD+SHIFT+P, typeShell Command: Install 'code' command in PATH, and press enter.
- Ensure Visual Studio Code is available on the command line via the
- Windows
- Git for Windows. Make sure its available on the command line via the system PATH. It's an option during installation.
- macOS
- XCode. Make sure to also install the command line tools
- Homebrew
- Linux
After successful installation, open a shell (or Git Bash on Windows), and run the tools/download-tools.sh script. It will download the remaining dependencies. On Linux, you may be prompted to install additional packages via your package manager.
You can now open the project in VS Code, or build and run it via the command line.
Note: the first time you open a source file in VS Code, you may be asked to install the
clangdserver. Just clickYesin the notification to do so.
output.mp4
The video demonstrates tools installation, building, and debugging for all supported platforms (desktop, web, DOS).
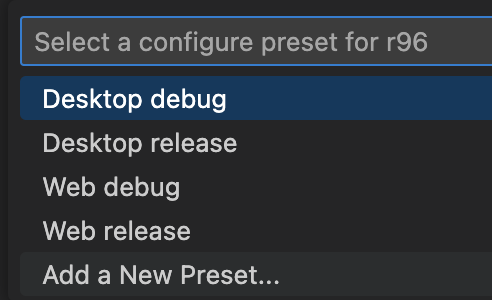
The project uses CMake as the build system. For each supported target platform, the build defines a CMake configure preset which will build the code in debug and release mode for the selected target platform. When you first open the r96 folder in VS Code, you'll be asked to select a configure preset.
Going with Desktop debug is a good starting point. You can switch the configure preset via the corresponding status bar entry.
You can now press the Build button in the status bar whenever you want to build the project for the specified configuration.
This will (incrementally) rebuild the code for the select platform. The resulting build output consisting of executables and assets can be found in build/<os>-debug. E.g. for Windows build/windows-debug, for macOS build/macos-debug, for DOS build/dos-debug and so on. When building a release preset, the output can be found in build/<os>-release.
To learn more about how to use VS Code CMake integration, check out the documentation.
The project comes with a .vscode/launch.json file which defines launch configurations for each platform. Click the launch button in the status bar to select the launch configuration and start a debugging session:
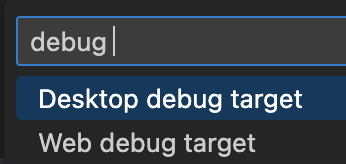
After clicking this status bar entry, you'll be asked to select a launch configuration:
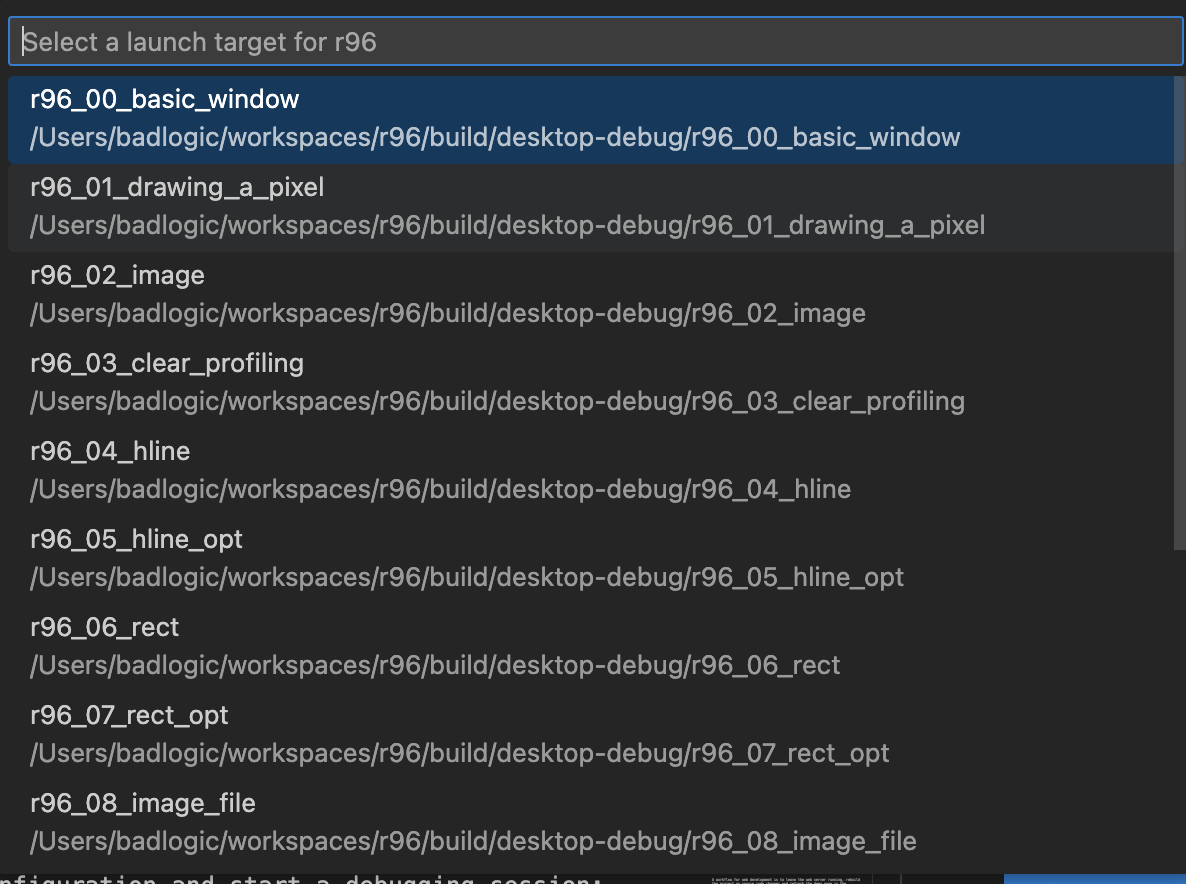
When you first start a debugging session, you'll be asked to select a launch target:
You can also change the launch target in the status bar:
After selecting the launch target, the code is incrementally rebuild, and the debugging session starts.
Instead of going through the status bar, you can also start a new debugging sessions by pressing F5. This will launch a session for the currently selected launch configuration, preset, and launch target.
Important: the launch configuration MUST match the preset you selected:
Desktop debug target: select theDesktop debugorDesktop releasepreset.Web debug target: select theWeb debugorWeb releasepreset.DOS debug target: selectDOS debugpreset.DOS run target: select theDOS releasepreset. This will run the program in DOSBox-x without attaching a debugger.
Each supported platform behaves a bit different to the others when debugging.
This is the standard debugging experience you are used to. Set breakpoints and watches, interrupt the program at any time, and so on.
Debugging the C code compiled to WASM directly in VS Code is not possible. When you start a web debugging session, the respective launch configuration starts a local static file server and opens the .html file corresponding to the selected launch target in a browser tab.
When you are done "debugging", close the browser tab, and close the debugging session in VS Code by clicking the "Stop" button in the debugger controls.
If you feel adventurous: it is possible to debug the C and JavaScript code it in Chrome when building with the Web debug preset.
For debugging to work in DOS, you need to integrate the GDB stub that is found in src/dos/gdbstub.h with the program. The general structure will look like this.
#define GDB_IMPLEMENTATION
#include "gdbstub.h"
int main(void) {
    gdb_start();
    ... setup code ...
    do {
        ... main loop ...
        gdb_checkpoint();
    } while (mfb_wait_sync(window));
}
The 12_hello_dos.c demo is an example on how to integrate the GDB stub.
The first two lines will pull in the implementation of the GDB stub.
The call to gdb_start() will setup some GDB stub internals, then wait for the debugger to connect. Once the debugger is connected, you can set breakpoints, step, or resume the program. If a breakpoint is hit, the GDB stub will take control of the program again, and talk to the debugger, until the debugger tells the stub to step or resume.
Finally, the call to gdb_checkpoint() at the end of the main loop gives the debugger a chance to tell the stub to interrupt the program.
When you are done with debugging, close DOSBox-x and close the debugging session in VS Code by clicking the "Stop" button in the debugger controls. You will not be able to start a new DOS debugging session unless the DOSBox-x window of a previous session is closed.
If the debugger gets stuck on start, or during debugging, close DOSBox-x, then in VS Code, open the command palette and execute
Debug: Stop.
To build for your operating system in release mode:
cmake --preset <os>-release
cmake --build build/<os>-release
Valid values for <os> are windows, linux, and macos. E.g. on Windows:
cmake --preset windows-release
cmake --build build/windows-release
The resulting executables for each demo app and the copied assets/ folder can then be found in the build/<os>-release directory. You can run them directly on your host system.
To build for your operating system in debug mode:
cmake --preset <os>-debug
cmake --build build/<os>-debug
The resulting executables and assets will end up in the build/<os>-debug directory.
You can either run the executables as is, or you can debug them with LLDB (Windows, macOS) or GDB (Linux) on the command line.
To build for the web in release mode:
cmake --preset web-release
cmake --build build/web-release
This will generate a .js and .wasm file for each executable in build/web-release, as well as copy over the corresponding .html file from the src/web folder and assets/ to build/web-release.
To run the demos in your browser execute:
./tools/web/static-server build/web-release 8000
A workflow for web development is to leave the web server running, rebuild the project on source code changes and refresh the demo page in the browser.
To build for the web in debug mode:
cmake --preset web-debug
cmake --build build/web-debug
The resulting .js, .wasm, and .html files as well as the assets will end up in build/web-debug.
To run the debuggable demos in your browser execute:
./tools/web/static-server build/web-debug 8000
You can debug both the JavaScript and C code in Chrome.
To build for DOS in release mode:
cmake --preset dos-release
cmake --build build/dos-release
The resulting executables for each demo app and the assets can then be found in the build/dos-release directory. You can run them via DOSBox-x like this:
./tools/dos/dosbox-x/dosbox-x -fastlaunch -exit -conf ./tools/dos/dosbox-x.conf build/dos-release/<executable-file.exe>
To build for DOS in debug mode:
cmake --preset dos-debug
cmake --build build/dos-debug
The resulting executables and assets can be found in build/dos-debug.
You can debug the executables running in DOSBox-x. Make sure to integrate the GDB stub that is found in src/dos/gdbstub.h like this:
#define GDB_IMPLEMENTATION
#include "gdbstub.h"
int main(void) {
    gdb_start();
    ... setup code ...
    do {
        ... main loop ...
        gdb_checkpoint();
    } while (mfb_wait_sync(window));
}
The 12_hello_dos.c demo is an example on how to integrate the GDB stub.
Run the executable in DOSBox-x:
./tools/dos/dosbox-x/dosbox-x -fastlaunch -exit -conf ./tools/dos/dosbox-x.conf build/dos-debug/<executable-file.exe>
The app will wait in gdb_start() for the debugger to connect.
Start GDB for DOS, load the debug info from the executable, and let it connect to the app running in DOSBox-x:
./tools/dos/gdb/gdb
(gdb) file build/dos-debug/<executable-file.exe>
(gdb) target remote localhost:5123
GDB will connect and stop in gdb_start(). You can now set breakpoints, step, continue, inspect local variables and so on.
The following dependencies will be installed. Some will be installed on a system level, others will be stored in tools/<platform>.
- Desktop
- CMake, a high-level build system. (system-level)
- Ninja, a lower-level build system, invoked by CMake. (system-level)
- VS Code extensions for C/C++ development (system-level)
- C/C++ Extension Pack, provides C/C++ debugging, CMake support, and bad intellisense, which is disabled in
.vscode/settings.json - clangd, provides good intellisense.
- Native Debug extension, needed to debug programs running in DOSBox-x.
- C/C++ Extension Pack, provides C/C++ debugging, CMake support, and bad intellisense, which is disabled in
- Web
- Python, required by Emscripten. (system-level)
- Static file server, a zero-dependecy, self-contained static file server used when working on WASM code. (
tools/web/) - Emscripten, a Clang-based toolchain to compile C/C++ to WASM. (
tools/web/)
- DOS
- GDB 7.1a, a fork of GDB specifically for debugging 32-bit protected mode DOS applications remotely. (
tools/dos/gdb) - DJGPP, a GCC-based toolchain to compile C/C++ to 32-bit protected mode DOS applications (Quake was built with this). (
tools/dos/djgpp) - DOSBox-x, a DOS emulator. This is a fork that fixes a few things to remotely debugging DJGPP-based programs works. (
tools/dos/dosbox-x)
- GDB 7.1a, a fork of GDB specifically for debugging 32-bit protected mode DOS applications remotely. (


