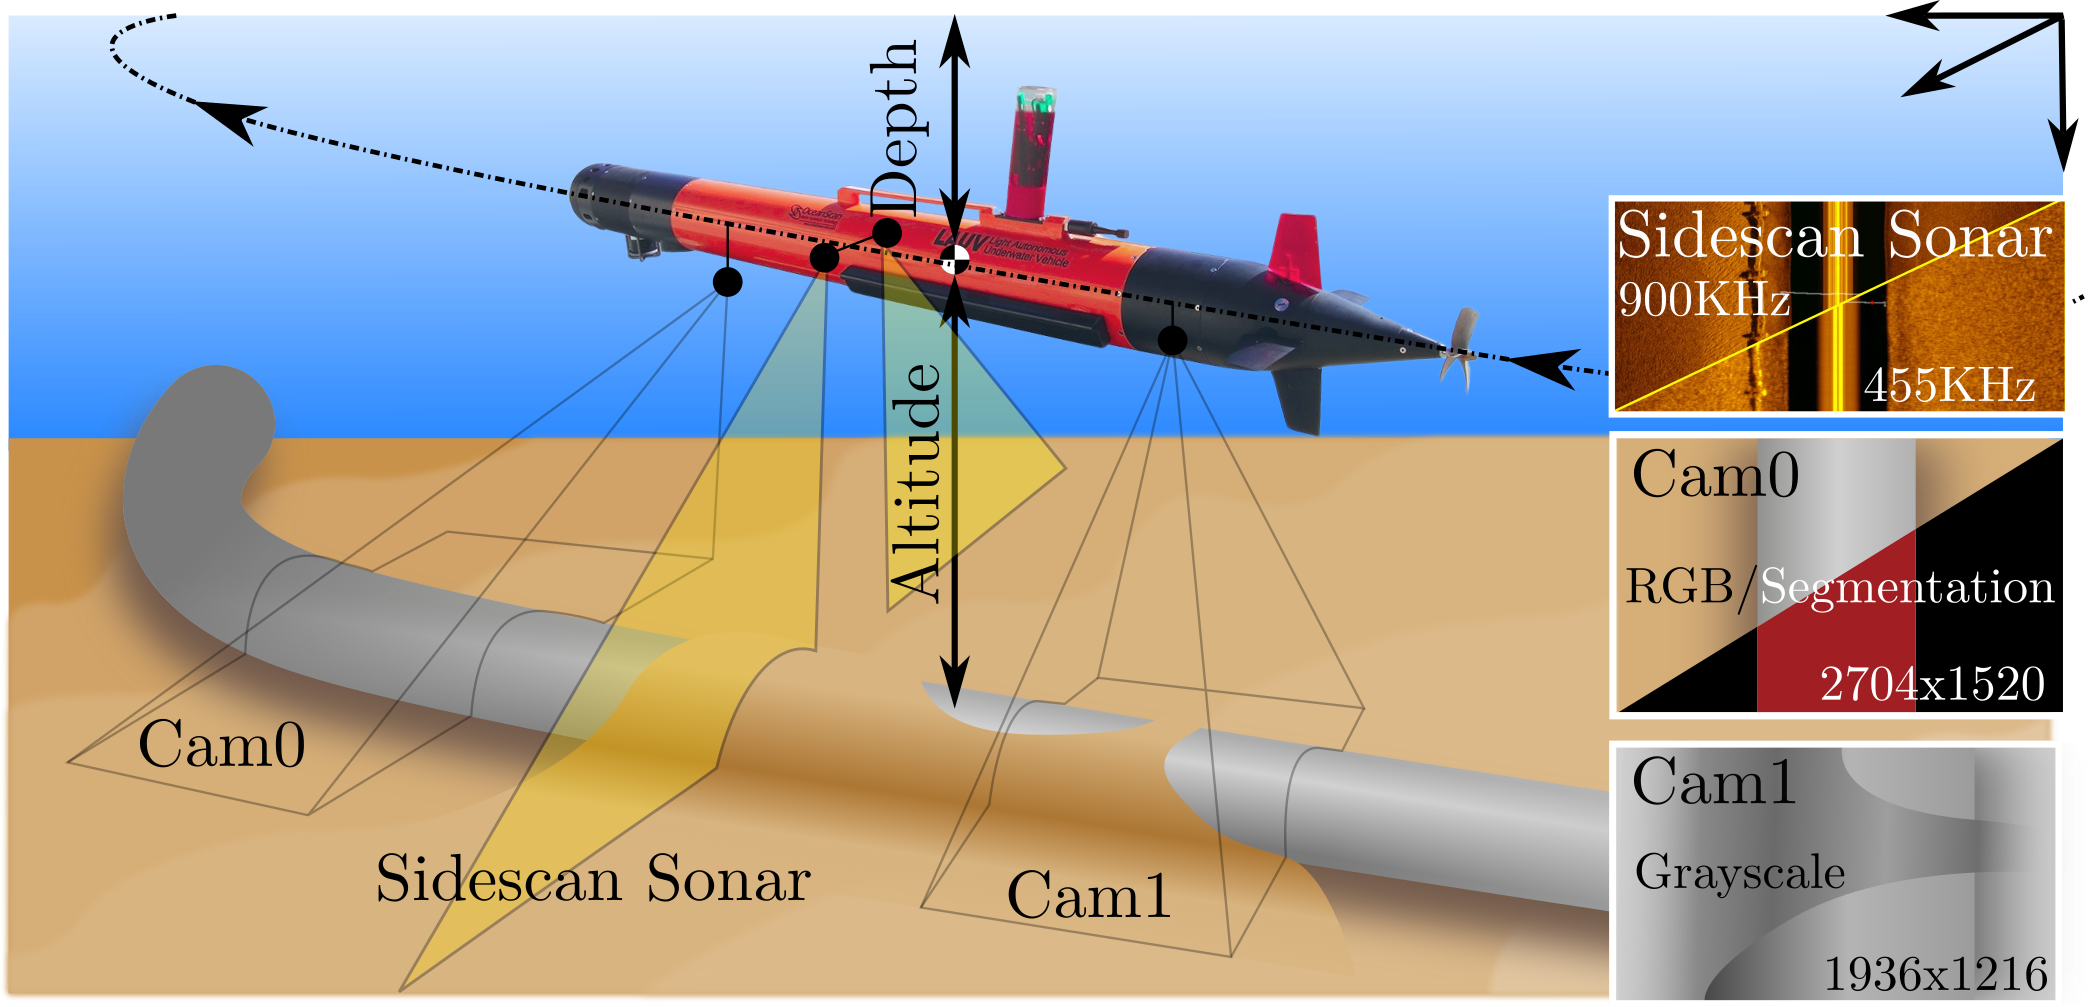
A Submarine Pipeline Inspection Dataset for Segmentation and Visual-inertial Localization. Here, you will find all the relevant information regarding the dataset introduced in our paper:
Álvarez-Tuñón, O., Marnet, L. R., Antal, L., Aubard, M., Costa, M., & Brodskiy, Y. (2024). SubPipe: A Submarine Pipeline Inspection Dataset for Segmentation and Visual-inertial Localization. arXiv preprint arXiv:2401.17907.
If any of this work has been useful in your research, please consider citing us 😃
You can download SubPipe from the following link
The dataset is divided into 5 Chunks. We exemplify SubPipe's structure with Chunk 0 as:
SubPipe
├── config.yaml
├── DATA
│   ├──Chunk0
│   │   ├── Acceleration.csv
│   │   ├── Altitude.csv
│   │   ├── AngularVelocity.csv
│   │   ├── Cam0_images
│   │   │   ├── <timestamp0>.jpg
│   │   │   ├── ...
│   │   │   └── <timestampN>.jpg
│   │   ├── Cam1_images
│   │   │   ├── <timestamp0>.jpg
│   │   │   ├── ...
│   │   │   └── <timestampN>.jpg
│   │   ├── Depth.csv
│   │   ├── EstimatedState.csv
│   │   ├── ForwardDistance.csv
│   │   ├── Pressure.csv
│   │   ├── Rpm.csv
│   │   ├── Segmentation
│   │   │   ├── <timestamp0>.png
│   │   │   ├── <timestamp0>_label.png
│   │   │   ├── ...
│   │   │   ├── <timestampN>.png
│   │   │   └── <timestampN>_label.png
│   │   ├── SSS_HF_images
│   │   │   ├── COCO_Annotation
│   │   │   |   └── coco_format.json
│   │   │   ├── Image
│   │   │   |   ├── <timestamp0>.pbm
│   │   │   |   ├── ...
│   │   │   |   └── <timestampN>.pbm
│   │   │   ├── YOLO_Annotation
│   │   │   |   ├── <timestamp0>.txt
│   │   │   |   ├── ...
│   │   │   |   └── <timestampN>.txt
│   │   ├── SSS_LF_images
│   │   │   ├── COCO_Annotation
│   │   │   |   └── coco_format.json
│   │   │   ├── Image
│   │   │   |   ├── <timestamp0>.pbm
│   │   │   |   ├── ...
│   │   │   |   └── <timestampN>.pbm
│   │   │   └── YOLO_Annotation
│   │   │       ├── <timestamp0>.txt
│   │   │       ├── ...
│   │   │       └── <timestampN>.txt
│   │   ├── Pressure.csv
│   │   ├── Temperature.csv
│   │   └── WaterVelocity.csv
│   ├──Chunk1
│   ├──Chunk2
│   ├──Chunk3
│   └──Chunk4
- Resolution: 1520x2704
- fx = 1612.36
- fy = 1622.56
- cx = 1365.43
- cy = 741.27
- k1,k2, p1, p2 = [−0.247, 0.0869, −0.006, 0.001]
Our paper proposes a set of metrics to compare SubPipe with existing datasets.
The folder dataset_metrics within this repo includes:
- The results from applying the metrics on state-of-the-art datasets -> 📂 here
- A notebook to plot the metrics -> 📓 here
- The code for deploying the metrics -> here. Note: you will need to configure your own dataloader.
The metrics proposed are delentropy and motion diversity. For more info about those metrics, consider reading our paper.
Our paper proposes a comprehensive set of experiments to demonstrate SubPipe's performance on different use-cases.
The algorithms tested in this paper are the geometry-based ORB-SLAM3 and DSO and the learning-based algorithm TartanVO. The data loaders for ORB-SLAM and DSO are gathered together in this repository that surveys monocular visual SLAM algorithms. It includes scripts for running the algorithms in your favourite datasets, including Subpipe. For more detailed info, we recommend you to read the repo's README.
Each sonar image was created after 20 “ping” (after every 20 new lines) which corresponds to approx. ~1 image / second.
Regarding the object detection annotations, we provide both COCO and YOLO formats for each annotation. A single COCO annotation file is provided per each chunk and per each frequency (low frequency vs. high frequency), whereas the YOLO annotations are provided for each SSS image file.
Metadata about the side-scan sonar images contained in this dataset:
Side-scan Sonar Images:
- # Low Frequency (LF): 5000
- LF image size: 2500 x 500
- # High Frequency (HF): 5030
- HF image size: 5000 x 500
- Total number of images: 10030
Number of Annotations:
- # Low Frequency: 3163
- # High Frequency: 3172
- Total number of annotations: 6335
SubPipe is a public dataset of a submarine outfall pipeline, property of Oceanscan-MST. This dataset was acquired with a Light Autonomous Underwater Vehicle by Oceanscan-MST, within the scope of Challenge Camp 1 of H2020 REMARO project.
More information about Oceanscan-MST can be found at this link.


This work is part of the Reliable AI for Marine Robotics (REMARO) Project. For more info, please visit: https://remaro.eu/

This project has received funding from the European Union's Horizon 2020 research and innovation programme under the Marie Skłodowska-Curie grant agreement No. 956200.
