ML-Logger makes it easy to:
- save data locally and remotely, as binary, in a transparent
picklefile, with the same API and zero configuration. - write from 500+ worker containers to a single instrumentation server
- visualize
matplotlib.pyplotfigures from a remote server locally withlogger.savefig('my_figure.png')
And ml-logger does all of these with minimal configuration — you can use the same logging code both locally and remotely with no code change.
ML-logger is highly performant -- the remote writes are asynchronous. For this reason it doesn't slow down your training even with 100+ metric keys.
Why did we built this, you might ask? Because we want to make it easy for people in ML to use the same logging code in all of they projects, so that it is easy to get started with someone else's baseline.
To install ml_logger, do:
pip install ml-loggerNow you can rock!
from ml_logger import logger
logger.configure('/tmp/ml-logger-debug')
# ~> logging data to /tmp/ml-logger-debug
Log key/value pairs, and metrics:
for i in range(1):
    logger.log(metrics={'some_val/smooth': 10, 'status': f"step ({i})"}, reward=20, timestep=i)
    ### flush the data, otherwise the value would be overwritten with new values in the next iteration.
    logger.flush()
# outputs ~>
# ╒════════════════════╤════════════════════════════╕
# │       reward       │             20             │
# ├────────────────────┼────────────────────────────┤
# │      timestep      │             0              │
# ├────────────────────┼────────────────────────────┤
# │  some val/smooth   │             10             │
# ├────────────────────┼────────────────────────────┤
# │       status       │          step (0)          │
# ├────────────────────┼────────────────────────────┤
# │      timestamp     │'2018-11-04T11:37:03.324824'│
# ╘════════════════════╧════════════════════════════╛Skip this if you just want to log locally. When training in parallel, you want to kickstart an logging server (Instrument Server). To do so, run:
python -m ml_logger.serverUse ssh tunnel if you are running on a managed cluster (with SLURM for instance).
A common scenario is you only want to upload averaged statistics of your metrics. A pattern
that @jachiam uses is the following: store_metrics(), peak_stored_metrics(), and log_metrics_summary()
# You log lots of metrics during training.
for i in range(100):
    logger.store_metrics(metrics={'some_val/smooth': 10}, some=20, timestep=i)
# you can peak what's inside the cache and print out a table like this:
logger.peek_stored_metrics(len=4)
# outputs ~>
#      some      |   timestep    |some_val/smooth
# ━━━━━━━━━━━━━━━┿━━━━━━━━━━━━━━━┿━━━━━━━━━━━━━━━
#       20       |       0       |      10
#       20       |       1       |      10
#       20       |       2       |      10
#       20       |       3       |      10

# The metrics are stored in-memory. Now we need to actually log the summaries:
logger.log_metrics_summary(silent=True)
# outputs ~> . (data is now logged to the server)- logging
matplotlib.pyplotfigures on an headless server - [documentation under construction]
First clone repo, install dev dependencies, and install the module under evaluation mode.
git clone https://github.com/episodeyang/ml_logger.git
cd ml_logger && cd ml_logger && pip install -r requirements-dev.txt
pip install -e .You should be inside ml_logger/ml_logger folder
pwd # ~> ml_logger/ml_logger
make testTo test with a live server, first run (in a separate console)
python -m ml_logger.server --log-dir /tmp/ml-logger-debug
or do:
make start-test-serverThen run this test script with the option:
python -m pytest tests --capture=no --log-dir http://0.0.0.0:8081or do
make test-with-serverYour PR should have both of these two tests working. ToDo: add CI to this repo.
You need twine, rst-lint etc, which are included in the requirements-dev.txt file.
from ml_logger import logger, Color, percent
from datetime import datetime

now = datetime.now()
logger.configure(log_directory="/tmp/ml-logger-demo", f"deep_Q_learning/{now:%Y%m%d-%H%M%S}")
This is a singleton pattern similar to matplotlib.pyplot. However, you could also use the logger constructor
from ml_logger import ML_Logger

logger = ML_Logger(log_directory="/tmp/ml-logger-demo", f"deep_Q_learning/{now:%Y%m%d-%H%M%S}")logger.log({"some_var/smooth": 10}, some=Color(0.85, 'yellow', percent), step=3)colored output: (where the values are yellow)
╒════════════════════╤════════════════════╕
│  some var/smooth   │         10         │
├────────────────────┼────────────────────┤
│        some        │       85.0%        │
╘════════════════════╧════════════════════╛
We have optimized ML-Logger, so it supports any format that pyplot supports. To save a figure locally or remotely,
import matplotlib.pyplot as plt
import numpy as np

xs = np.linspace(-5, 5)

plt.plot(xs, np.cos(xs), label='Cosine Func')
logger.savefig('cosine_function.pdf')It is especially hard to visualize RL training sessions on a remote computer. With ML-Logger this is easy, and
super fast. We optimized the serialization and transport process, so that a large stack of video tensor gets
first compressed by ffmepg before getting sent over the wire.
The compression rate (and speed boost) can be 2000:1.
import numpy as np

def im(x, y):
    canvas = np.zeros((200, 200))
    for i in range(200):
        for j in range(200):
            if x - 5 < i < x + 5 and y - 5 < j < y + 5:
                canvas[i, j] = 1
    return canvas

frames = [im(100 + i, 80) for i in range(20)]

logger.log_video(frames, "test_video.mp4")PyTorch has a very nice module saving and loading API that has inspired the one in Keras. We make it easy to save
this state dictionary (state_dict) to a server, and load it. This way you can load from 100+ of your previous
experiments, without having to download those weights to your code repository.
# save a module
logger.save_module(FastCNN=cnn)

# load a module
state_dict, = logger.load_pkl(f"modules/{0:04d}_Test.pkl")The format tensorflow uses to save the models is opaque. I prefer to save model weights in pickle as a dictionary.
This way the weight files are transparent. ML_Logger offers easy helper functions to save and load from checkpoints
saved in this format:
## To save checkpoint
from ml_logger import logger
import tensorflow as tf

logger.configure(log_directory="/tmp/ml-logger-demos")

x = tf.get_variable('x', shape=[], initializer=tf.constant_initializer(0.0))
y = tf.get_variable('y', shape=[], initializer=tf.constant_initializer(10.0))
c = tf.Variable(1000)

sess = tf.InteractiveSession()
sess.run(tf.global_variables_initializer())

trainables = tf.trainable_variables()
logger.save_variables(trainables, path="variables.pkl", namespace="checkpoints")
which creates a file checkpoints/variables.pkl under /tmp/ml-logger-demos.
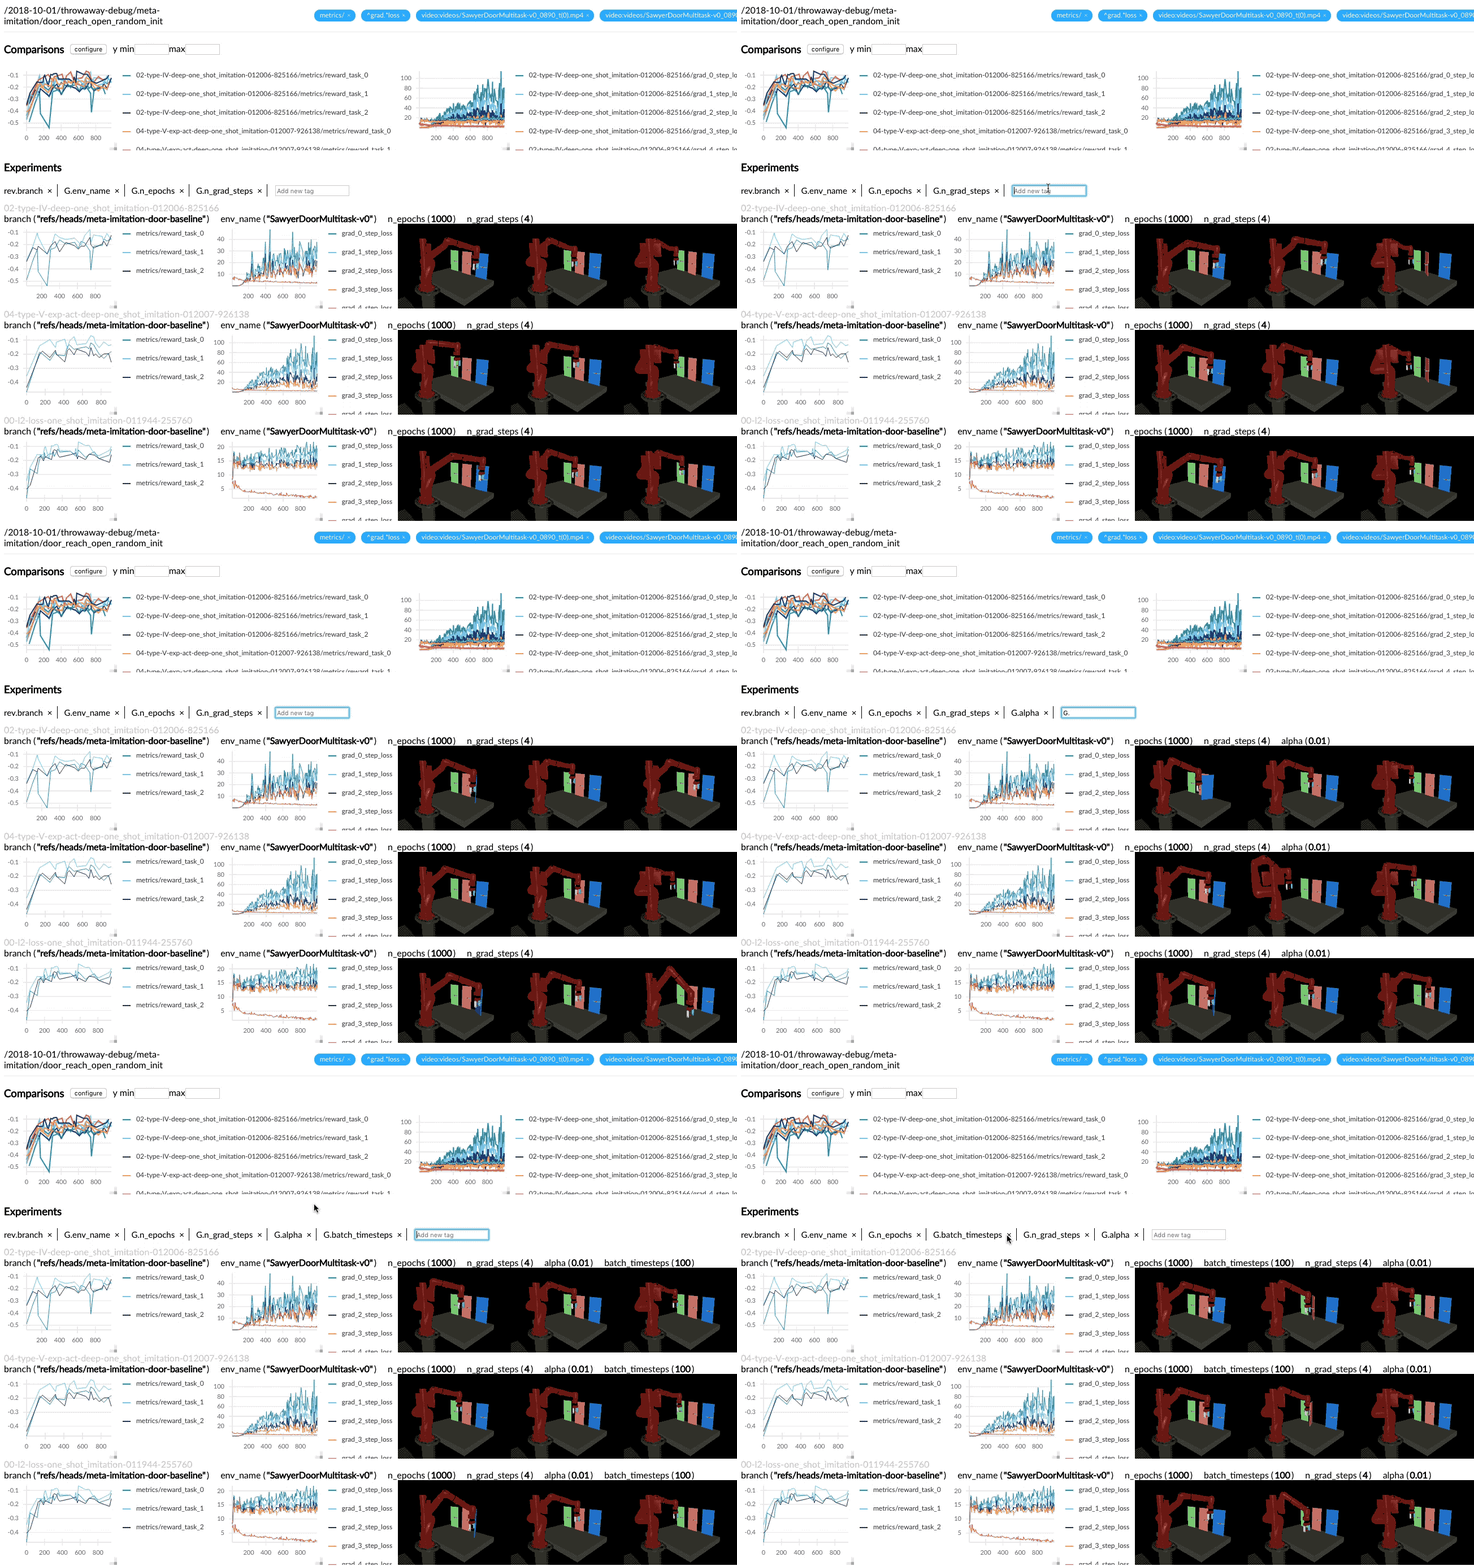
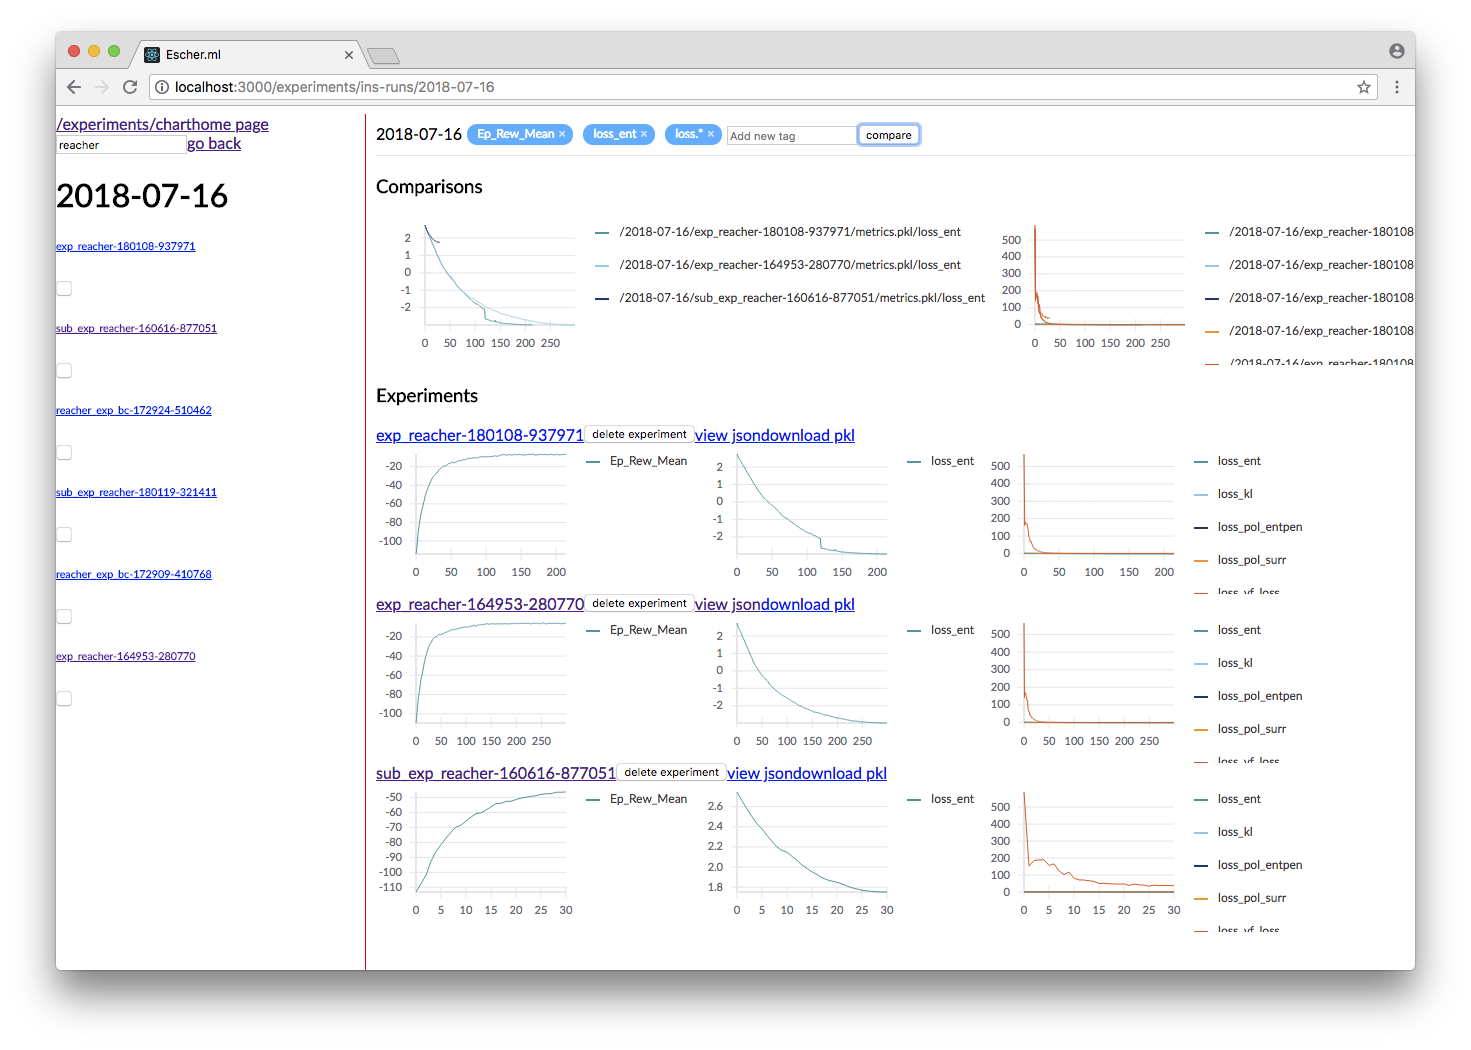
An idea visualization dashboard would be
- Fast, instantaneous. On an AWS headless server? View the plots as if they are on your local computer.
- Searchable, performantly. So that you don't have to remember where an experiment is from last week.
- Answer Questions, from 100+ Experiments. We make available Google's internal hyperparameter visualization tool, on your own computer.
Experiments are identified by the metrics.pkl file. You can log multiple times to the same metrics.pkl file,
and the later parameter values overwrites earlier ones with the same key. We enforce namespace in this file, so each
key/value argument you pass into the logger.log_parameters function call has to be a dictionary.
Args = dict(
    learning_rate=10,
    hidden_size=200
)
logger.log_parameters(Args=Args)This requires node.js and yarn dev environment at the moment. We will streamline this process without these requirements soon.
- download this repository
- go to
ml-vis-appfolder - Install the dev dependencies
- install node: Installation
- install yarn: Installation
- install the dependencies of this visualization app:
yarn install
- in that folder, run
yarn.
The IP address of the server is currently hard coded here. To use this with your own instrumentation server, over-write this line. I'm planning on making this configuration more accessible.
from ml_logger import logger, Color, percent

logger.log_params(G=dict(some_config="hey"))
logger.log(some=Color(0.1, 'yellow'), step=0)
logger.log(some=Color(0.28571, 'yellow', lambda v: "{:.5f}%".format(v * 100)), step=1)
logger.log(some=Color(0.85, 'yellow', percent), step=2)
logger.log({"some_var/smooth": 10}, some=Color(0.85, 'yellow', percent), step=3)
logger.log(some=Color(10, 'yellow'), step=4)
colored output: (where the values are yellow)
╒════════════════════╤════════════════════╕
│        some        │        0.1         │
╘════════════════════╧════════════════════╛
╒════════════════════╤════════════════════╕
│        some        │     28.57100%      │
╘════════════════════╧════════════════════╛
╒════════════════════╤════════════════════╕
│        some        │       85.0%        │
╘════════════════════╧════════════════════╛
╒════════════════════╤════════════════════╕
│  some var/smooth   │         10         │
├────────────────────┼────────────────────┤
│        some        │       85.0%        │
╘════════════════════╧════════════════════╛
In your project files, do:
from params_proto import cli_parse
from ml_logger import logger


@cli_parse
class Args:
    seed = 1
    D_lr = 5e-4
    G_lr = 1e-4
    Q_lr = 1e-4
    T_lr = 1e-4
    plot_interval = 10
    log_dir = "http://54.71.92.65:8081"
    log_prefix = "./runs"

logger.configure(log_directory="http://some.ip.address.com:2000", prefix="your-experiment-prefix!")
logger.log_params(Args=vars(Args))
logger.log_file(__file__)


for epoch in range(10):
    logger.log(step=epoch, D_loss=0.2, G_loss=0.1, mutual_information=0.01)
    logger.log_key_value(epoch, 'some string key', 0.0012)
    # when the step index updates, logger flushes all of the key-value pairs to file system/logging server

logger.flush()

# Images
face = scipy.misc.face()
face_bw = scipy.misc.face(gray=True)
logger.log_image(index=4, color_image=face, black_white=face_bw)
image_bw = np.zeros((64, 64, 1))
image_bw_2 = scipy.misc.face(gray=True)[::4, ::4]

logger.log_image(i, animation=[face] * 5)
This version of logger also prints out a tabular printout of the data you are logging to your stdout.
- can silence
stdoutper key (perlogger.logcall) - can print with color:
logger.log(timestep, some_key=green(some_data)) - can print with custom formatting:
logger.log(timestep, some_key=green(some_data, percent))wherepercent - uses the correct
unixtable characters (please stop using|and+. Use│,┼instead)
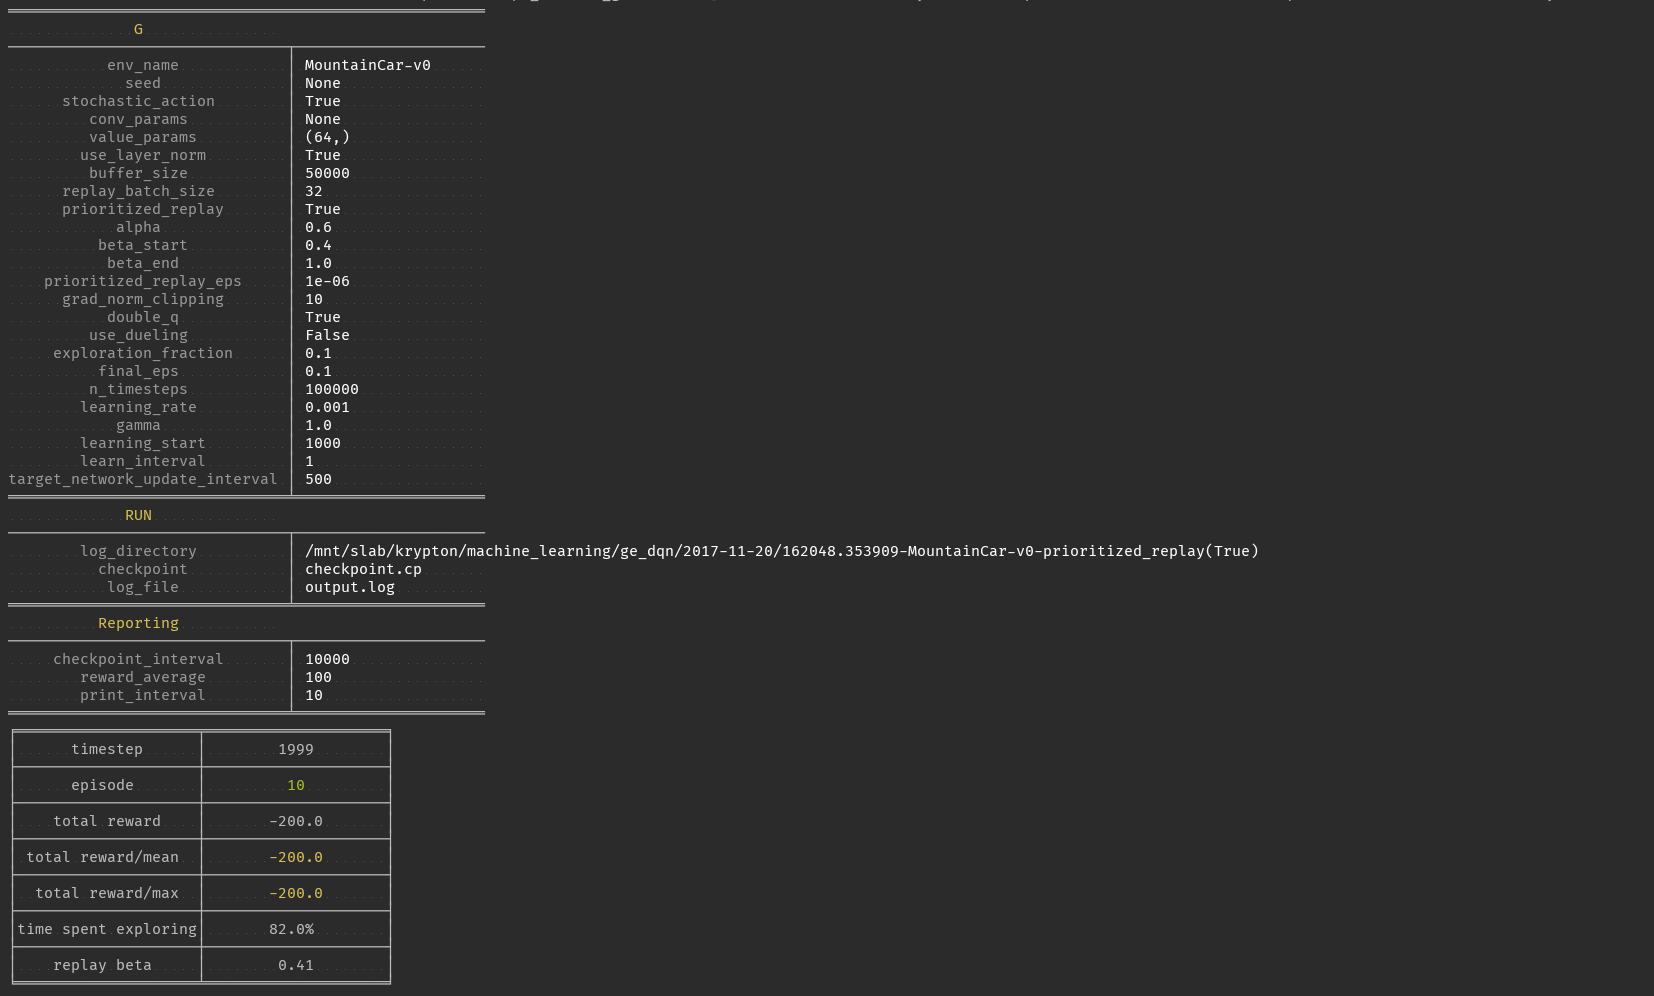
A typical print out of this logger look like the following:
from ml_logger import ML_Logger

logger = ML_Logger(log_directory=f"/mnt/bucket/deep_Q_learning/{datetime.now(%Y%m%d-%H%M%S.%f):}")

logger.log_params(G=vars(G), RUN=vars(RUN), Reporting=vars(Reporting))
outputs the following
═════════════════════════════════════════════════════
              G
───────────────────────────────┬─────────────────────
           env_name            │ MountainCar-v0
             seed              │ None
      stochastic_action        │ True
         conv_params           │ None
         value_params          │ (64,)
        use_layer_norm         │ True
         buffer_size           │ 50000
      replay_batch_size        │ 32
      prioritized_replay       │ True
            alpha              │ 0.6
          beta_start           │ 0.4
           beta_end            │ 1.0
    prioritized_replay_eps     │ 1e-06
      grad_norm_clipping       │ 10
           double_q            │ True
         use_dueling           │ False
     exploration_fraction      │ 0.1
          final_eps            │ 0.1
         n_timesteps           │ 100000
        learning_rate          │ 0.001
            gamma              │ 1.0
        learning_start         │ 1000
        learn_interval         │ 1
target_network_update_interval │ 500
═══════════════════════════════╧═════════════════════
             RUN
───────────────────────────────┬─────────────────────
        log_directory          │ /mnt/slab/krypton/machine_learning/ge_dqn/2017-11-20/162048.353909-MountainCar-v0-prioritized_replay(True)
          checkpoint           │ checkpoint.cp
           log_file            │ output.log
═══════════════════════════════╧═════════════════════
          Reporting
───────────────────────────────┬─────────────────────
     checkpoint_interval       │ 10000
        reward_average         │ 100
        print_interval         │ 10
═══════════════════════════════╧═════════════════════
╒════════════════════╤════════════════════╕
│      timestep      │        1999        │
├────────────────────┼────────────────────┤
│      episode       │         10         │
├────────────────────┼────────────────────┤
│    total reward    │       -200.0       │
├────────────────────┼────────────────────┤
│ total reward/mean  │       -200.0       │
├────────────────────┼────────────────────┤
│  total reward/max  │       -200.0       │
├────────────────────┼────────────────────┤
│time spent exploring│       82.0%        │
├────────────────────┼────────────────────┤
│    replay beta     │        0.41        │
╘════════════════════╧════════════════════╛
In addition, ml-logger also comes with a powerful visualization dashboard that beats tensorboard in every aspect.
A common pain that comes after getting to launch ML training jobs on AWS is a lack of a good way to manage and visualize your data. So far, a common practice is to upload your experiment data to aws s3 or google cloud buckets. Then one quickly realizes that downloading data from s3 can be slow. s3 does
not offer diffsync like gcloud-cli's g rsync. This makes it hard to sync a
large collection of data that is constantly appended to.
So far the best way we have found for organizing experimental data is to
have a centralized instrumentation server. Compared with managing your data
on S3, a centralized instrumentation server makes it much easier to move
experiments around, run analysis that is co-located with your data, and
hosting visualization dashboards on the same machine. To download data
locally, you can use sshfs, smba, rsync or a variety of remote disks. All
faster than s3.
ML-Logger is the logging utility that allows you to do this. To make ML_logger
easy to use, we made it so that you can use ml-logger with zero configuration,
logging to your local hard-drive by default. When the logging directory field
logger.configure(log_directory= <your directory>) is an http end point,
the logger will instantiate a fast, future based logging client that launches
http requests in a separate thread. We optimized the client so that it won't
slow down your training code.
API wise, ML-logger makes it easy for you to log textual printouts, simple
scalars, numpy tensors, image tensors, and pyplot figures. Because you might
also want to read data from the instrumentation server, we also made it possible to
load numpy, pickle, text and binary files remotely.
In the future, we will start building an integrated dashboard with fast search, live figure update and markdown-based reporting/dashboarding to go with ml-logger.
Now give this a try, and profit!


