David Novak, Cyril de Bodt, Pierre Lambert, John A. Lee, Sofie Van Gassen, Yvan Saeys
ViScore is a toolkit for evaluation of dimensionality reduction.
It is published together with ViVAE, a toolkit for single-cell data denoising and dimensionality reduction.
ViScore is a Python package. We recommend creating a new Anaconda environment for ViScore, or using the one you may have already created for ViVAE.
On Linux or macOS, use the command line for installation. On Windows, use Anaconda Prompt.
(A test install run on 2020 MacBook Air runs for under 1 minute.)
conda create --name ViScore --channel conda-forge python=3.9 \
    numpy==1.22.4 numba==0.58.1 scikit-learn==1.3.2 scipy==1.11.4 pynndescent==0.5.11 matplotlib==3.8.2 pyemd==1.0.0
conda activate ViScore
pip install --upgrade git+https://github.com/saeyslab/ViScore.git
ViScore uses unsupervised scores for assessing local and global structure preservation in low-dimensional (LD) embeddings of high-dimensional (HD) data. If working with labelled data, supervised evaluation metrics can be used to elucidate source of error (shape and positional distortion).
See documentation for ViScore.score, ViScore.xnpe, ViScore.neighbourhood_composition and ViScore.neighbourhood_composition_plot.
ViScore enables unsupervised assessment of structure preservation in LD embeddings of HD data using scores based on
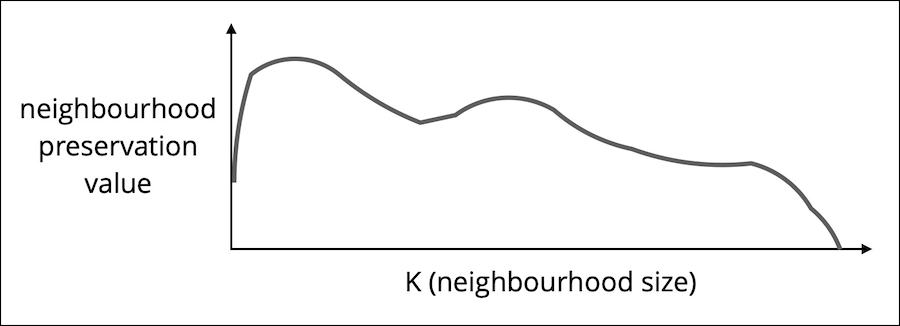
RNX curves show (scaled) overlap between neighbour ranks for all neighbourhoods of size from 1 to N-1.
-
Taking the AUC (Area-Under-Curve) with logarithmic scale for K (neighbourhood size), we effectively up-weight the significance of local neighbourhoods, without setting a hard cut-off for what is still considered local. This is the local structure-preservation score
$S_{L}$ . -
Taking the AUC with linear scale for K, we dispense with the locality bias and assume equal importance for all neighbourhood scales. This is the global structure-preservation score
$S_{G}$ .
Since the computation of an ViScore.score.
The scRNA-seq example below includes an application of this.
In our online tutorial for dimensionality reduction of biological (scRNA-seq) data using ViVAE we use ViScore to compute structure-preservation scores (see section 4) given a ViVAE and UMAP embedding of the same dataset.
This tutorial contains instructions for running the workflow locally or remotely. The user can adapt the code to use different dimensionality reduction tools, hyperparameters or datasets.
The pre-print of our publication is available here on bioRxiv.
It describes underlying methodology of ViVAE and ViScore, reviews past work in dimensionality reduction and evaluation of it and links to publicly available datasets on which performance of ViVAE was evaluated.
