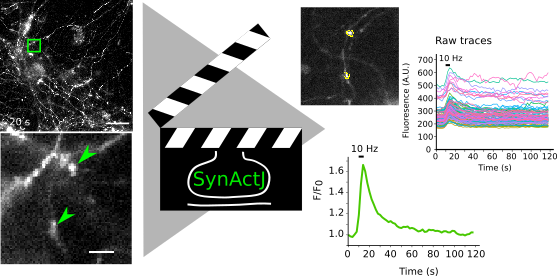
Synaptic Activity in ImageJ (SynActJ) is an image and data analysis workflow that allows to analyze synaptic activity. It is based on a Fiji plugin and a R Shiny App that implement the automated image analysis of active synapses in time-lapse movies. We tested the workflow with movies of pHluorin or calcium sensors.
SynActJ Shiny performs the data analysis for the data generated by the SynActJ Fiji plugin:
SynActJ github pages
SynActJ plugin repository
The R data processing and plotting is implemented as Shiny App. This allows you to read in the output data and execute the data processing using a graphical interface. Overview plots as well as detail plots are shown in the SynActJ Shiny App directly for user convenience.
For the data analysis you need to download R and RStudio: R Version 4.1.0
Link to R
Select version 4.1.0
RStudio 1.4.1717
Link to RStudio
- Download the contents of the repository: SynActJ Shiny
Click on the green button: Code.
Press Download ZIP to download the scripts. - Unzip the script to a location of your choice.
- Open the app.R file in RStudio.
- Start the application: press Run App - top right corner of RStudio.
- RStudio may ask to install or load extra packages - Download will take some time.
- Once these packages are installed and loaded the RShiny GUI should pop up.
- Optional: Press Open in Browser for a better rendering of the GUI.