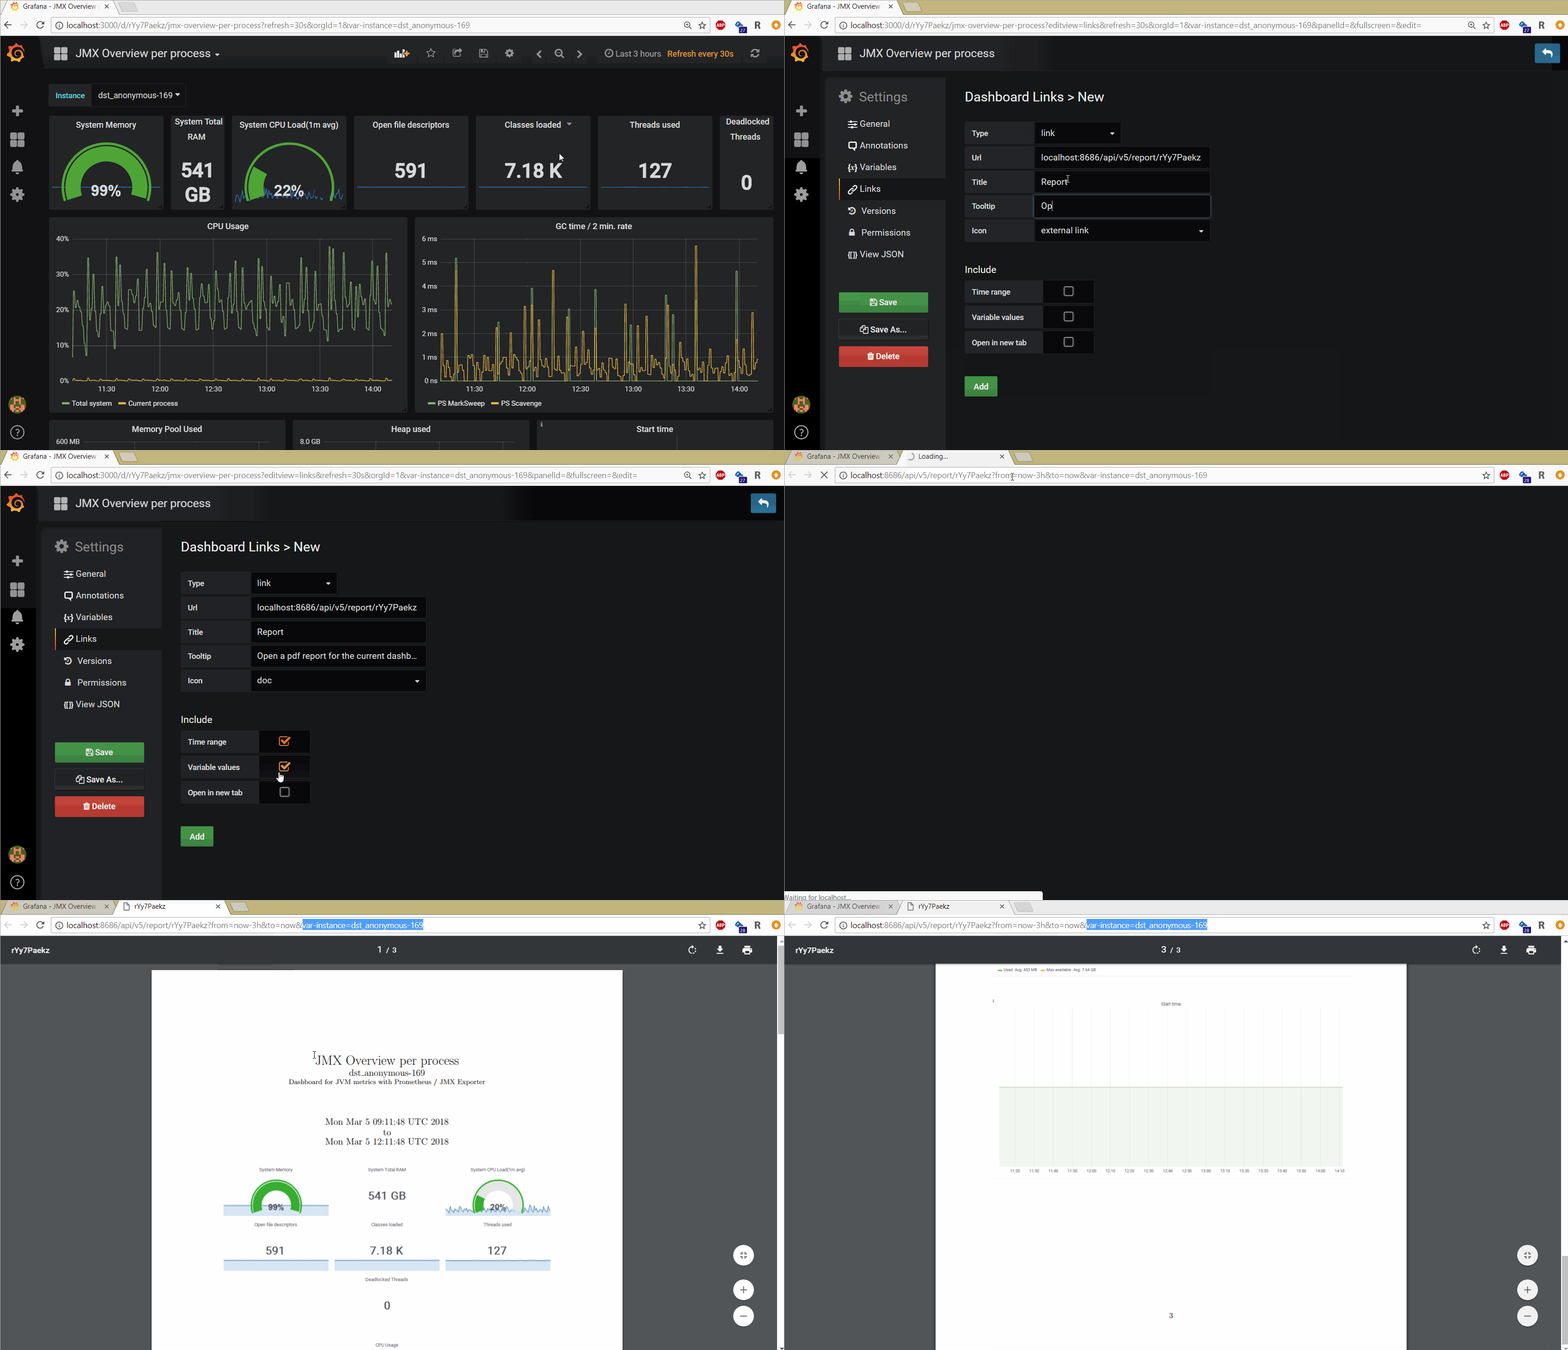
A simple http service that generates *.PDF reports from Grafana dashboards.
Runtime requirements
pdflatexinstalled and available in PATH.- a running Grafana instance that it can connect to. If you are using an old Grafana (version < v5.0), see
Deprecated Endpointbelow.
Build requirements:
Get the source files and dependencies:
go get github.com/IzakMarais/reporter/...
Build and install grafana-reporter binary to $GOPATH/bin:
go install -v github.com/IzakMarais/reporter/cmd/grafana-reporter
Running without any flags assumes Grafana is reachable at localhost:3000:
grafana-reporter
Query available flags. Likely the only one you need to set is -ip.
grafana-reporter --help
-cmd_apiKey string
      Grafana api key. Required (and only used) in command line mode.
-cmd_apiVersion string
      Api version: [v4, v5]. Required (and only used) in command line mode, example: -apiVersion v5. (default "v5")
-cmd_dashboard string
      Dashboard identifier. Required (and only used) in command line mode.
-cmd_enable
      Enable command line mode. Generate report from command line without starting webserver (-cmd_enable=1).
-cmd_o string
      Output file. Required (and only used) in command line mode. (default "out.pdf")
-cmd_template string
      Specify a custom TeX template file. Only used in command line mode, but is optional even there.
-cmd_ts string
      Time span. Required (and only used) in command line mode. (default "from=now-3h&to=now")
-grid-layout
      Enable grid layout (-grid-layout=1). Panel width and height will be calculated based off Grafana gridPos width and height.
-ip string
      Grafana IP and port. (default "localhost:3000")
-port string
      Port to serve on. (default ":8686")
-proto string
      Grafana Protocol. Change to 'https://' if Grafana is using https. Reporter will still serve http. (default "http://")
-ssl-check
      Check the SSL issuer and validity. Set this to false if your Grafana serves https using an unverified, self-signed certificate. (default true)
-templates string
      Directory for custom TeX templates. (default "templates/")
The reporter serves a pdf report on the specified port at:
/api/v5/report/{dashboardUID}
where {dashboardUID} is the dashboard uid as used in the Grafana dashboard's URL.
E.g. SoT6hL6zk from http://grafana-host:3000/d/SoT6hL6zk/descriptive-name.
For more about this uid, see the Grafana HTTP API.
In Grafana v5.0, the Grafana HTTP API for dashboards was changed. The reporter still works with the previous Grafana API too, but serves pdf reports at a different endpoint. So, if you use Grafana v4, you need to download your reports from here instead:
/api/report/{dashboardname}
where {dashboardname} is the same name as used in the Grafana v4 dashboard's URL.
E.g. backend-dashboard from http://grafana-host:3000/dashboard/db/backend-dashboard.
This endpoint is deprecated and may be dropped in a future release of the grafana-reporter.
The endpoint supports the following optional query parameters. These can be combined using standard URL query parameter syntax, eg:
/api/v5/report/{dashboardUID}?apitoken=12345&var-host=devbox
Time span: The time span query parameter syntax is the same as used by Grafana.
When you create a link from Grafana, you can enable the Time range forwarding check-box.
The link will render a dashboard with your current time range.
By default, the time range will be included as the report sub-title.
Times are displayed using the reporter's host server time zone.
variables: The template variable query parameter syntax is the same as used by Grafana. When you create a link from Grafana, you can enable the Variable values forwarding check-box. The link will render a dashboard with your current variable values.
apitoken: A Grafana authentication api token. Use this if you have auth enabled on Grafana.
Syntax: apitoken={your-tokenstring}. If you are getting Got Status 401 Unauthorized, message: {"message":"Unauthorized"}
error messages, typically it is because you forgot to set this parameter.
template: Optionally specify a custom TeX template file.
Syntax template=templateName implies the grafana-reporter should have access to a template file on the server at templates/templateName.tex.
The templates directory can be set with a command line parameter.
See the LaTeX code in texTemplate.go as an example of what variables are available and how to access them.
Also see this issue for an example.
If you prefer to generate a report directly from the command line without running a webserver,
command line mode enables this. All flags related to command line mode are
prefixed with cmd_ to distinguish them from regular flags:
grafana-reporter -cmd_enable=1 -cmd_apiKey [api-key] -ip localhost:3000 -cmd_dashboard ITeTdN2mk -cmd_ts from=now-1y -cmd_o out.pdf
A Docker image is available. To see available flags:
docker run izakmarais/grafana-reporter --help
To run with default flags, use --net to enable Docker to connect to Grafana at localhost:3000:
docker run -p 8686:8686 --net="host" izakmarais/grafana-reporter
If you also have Make and Docker-compose installed, you can run a simple local orchestration of Grafana and Grafana-reporter:
 go get github.com/IzakMarais/reporter/ ...
 cd $GOPATH/src/github.com/IzakMarais/reporter
 make compose-up
Then open a browser to http://localhost:3000 and create a new test dashboard. Add the example graph and save the dashboard.
Observe the new URL and find the dashboard UID, e.g. qaJCuCezz from http://localhost:3000/d/qaJCuCezz/new-dashboard-copy
Next, go to: http://localhost:8080/api/v5/report/qaJCuCezz, which will output the grafana-reporter PDF.
The unit tests can be run using the go tool:
go test -v github.com/IzakMarais/reporter/...
or, the GoConvey webGUI:
./bin/goconvey -workDir `pwd`/src/github.com/IzakMarais -excludedDirs `pwd`/src/github.com/IzakMarais/reporter/tmp/
A new release requires changes to the git tag, cmd/grafana-reporter/version.go and Makefile: docker-build job.
Build the Docker image and push to Dockerhub. Build the Windows and Linux binaries and upload to Github
using make buildall.
