Docker for SLIDE will be made available soon
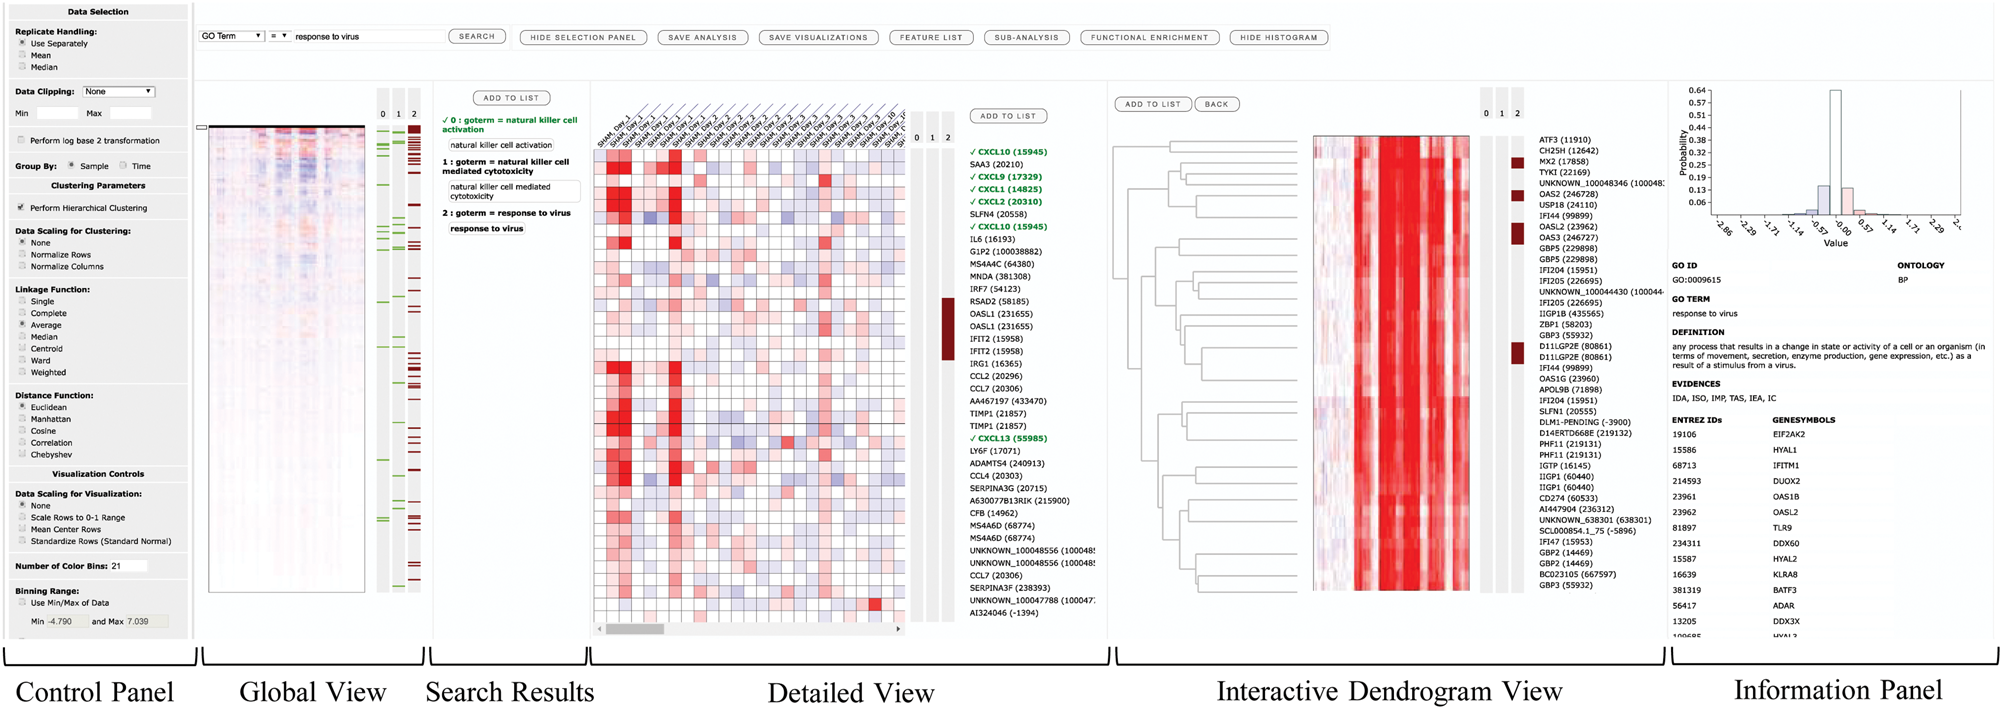
SLIDE is a tool for customized visualization and interactive exploration of high throughput quantitative -omics data. SLIDE can organize and visualize quantitative -omics data in expression based heatmaps on a standard web browser. It allows users to interactively navigate through the heatmaps and create sub-analyses of selected feature sets. It can be used to visualize the data at different levels of granularity through multiple simultaneous views.
If you use this tool, please cite the following work:
Soumita Ghosh, Abhik Datta, Kaisen Tan, Hyungwon Choi; SLIDE – a web-based tool for interactive visualization of large-scale – omics data, Bioinformatics, Volume 35, Issue 2, 15 January 2019, Pages 346–348, https://doi.org/10.1093/bioinformatics/bty534
- User Manual
- Stand-alone Version (for installation on user's computer)
- Windows Installation Guide
- macOS Installation Guide
SLIDE is available as a stand-alone version (for installation on user's computer).
Before you can configure SLIDE to run in your local environment, please install the following softwares:
- Java Development Kit (JDK)
- GlassFish Server
- MongoDB
- Python
- Numpy (Python Package)
- Scipy (Python Package)
- fastcluster (Python Package)
Please refer to the installation guide (Windows / macOS) for more details.
SLIDE takes an input data file containing the matrix of expression values in a text delimited format (comma, tab, space, semi-colon, pipe). The data file should not contain single or double quotes. For querying and tagging of features (genes), the input data file must have at least one column containing the following identifiers (referred to as meta data column in SLIDE): Entrez ID, official gene symbols, Ensemble IDs (gene or transcript), RefSeq Accession ID or Uniprot ID. It is still possible to visualize the data without any standard identifiers, although search and tagging of genes will not be available in this case.
Sample input data files can be found here.
Sample information file should be prepared in a text file with a specific delimiter (comma, tab, space, semi-colon, pipe), where each line contains the meta data for a sample, whose quantitative molecular data is in a column in the input data. The file is used to infer replicate and sample group information, which determines column ordering during visualization.
If sample grouping or replicate information is not available, no sample information file is required in that case.
Example sample information files can be found here.
Please refer to the User Manual for more details on the input data file and sample information file formats.
SLIDE repository is organized into three folders.
- application The entire content in this folder needs to be downloaded to configure SLIDE locally on your computer
- data This folder contains example input datasets and sample information files
- source This folder contains the source code for SLIDE
Systems-Level Interactive Data Exploration (SLIDE) is a user-driven interactive visualization tool for large-scale –omics data. This document describes the step-by-step guideline for using SLIDE’s functionalities. SLIDE is distributed under the BSD license. See the LICENSE.txt in the source distribution or here.
