Datasource backend for the Grafana Simple JSON datasource plugin.
Versions previous to 0.7 returned the raw geo:json data. This was in keeping
with the support from the trackmap panel. Newer version (2.x) of the
panel does not support geo:json, and hence this data source returns the same
data in raw table form as documented by the panel.
Retrieves events stored in geo:json format in Akumuli in response to the endpoints mandated by the SimpleJson plugin. We use the datasource to display location information on Grafana using the trackmap panel.
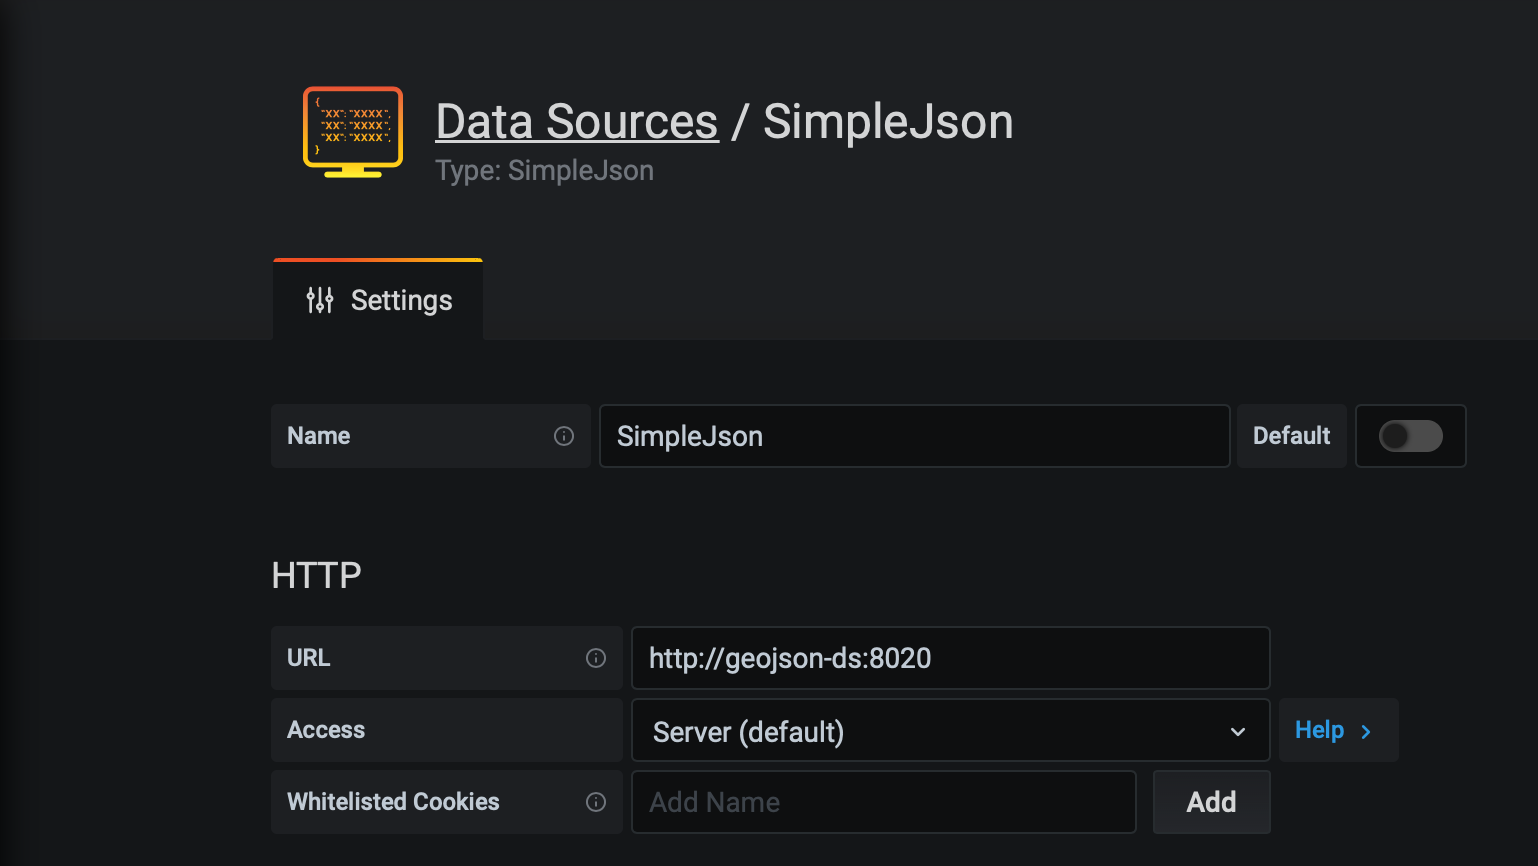
Configuration of the datasource follows standard Grafana workflow.
Deploy the service and point the SimpleJson datasource to use the service as the backend provider.
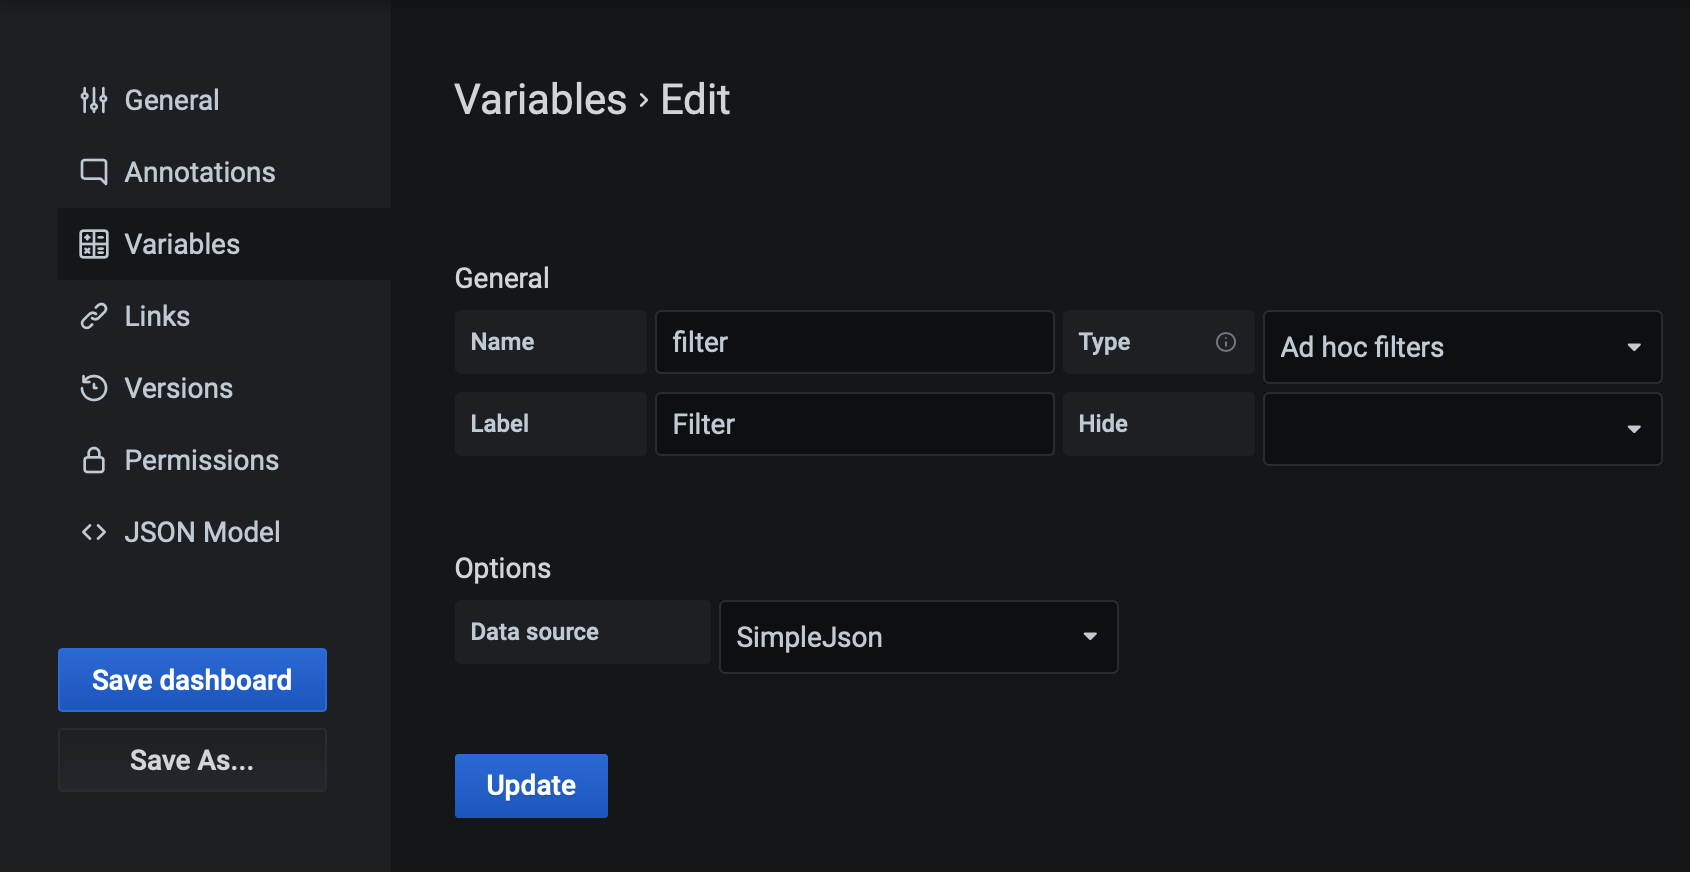
Grafana dashboards where this datasource is used can use a variable to add adhoc filters to the Akumuli queries. For the variable, select Ad hoc filters as the Type. Select SimpleJson as the Data source. The variable can be named as convenient.
The set up is illustrated in the following screen capture.
The other requirement is that the service be configured with a metric which can be used to query for tag keys and values. This is a limitation in Grafana, where no metric context is available in the requests to the backend service for tag keys or values.
Location query panels can be created using the SimpleJson datasource. Select
the timeserie of interest using the list of series names returned by the
auto-complete (/search) service.
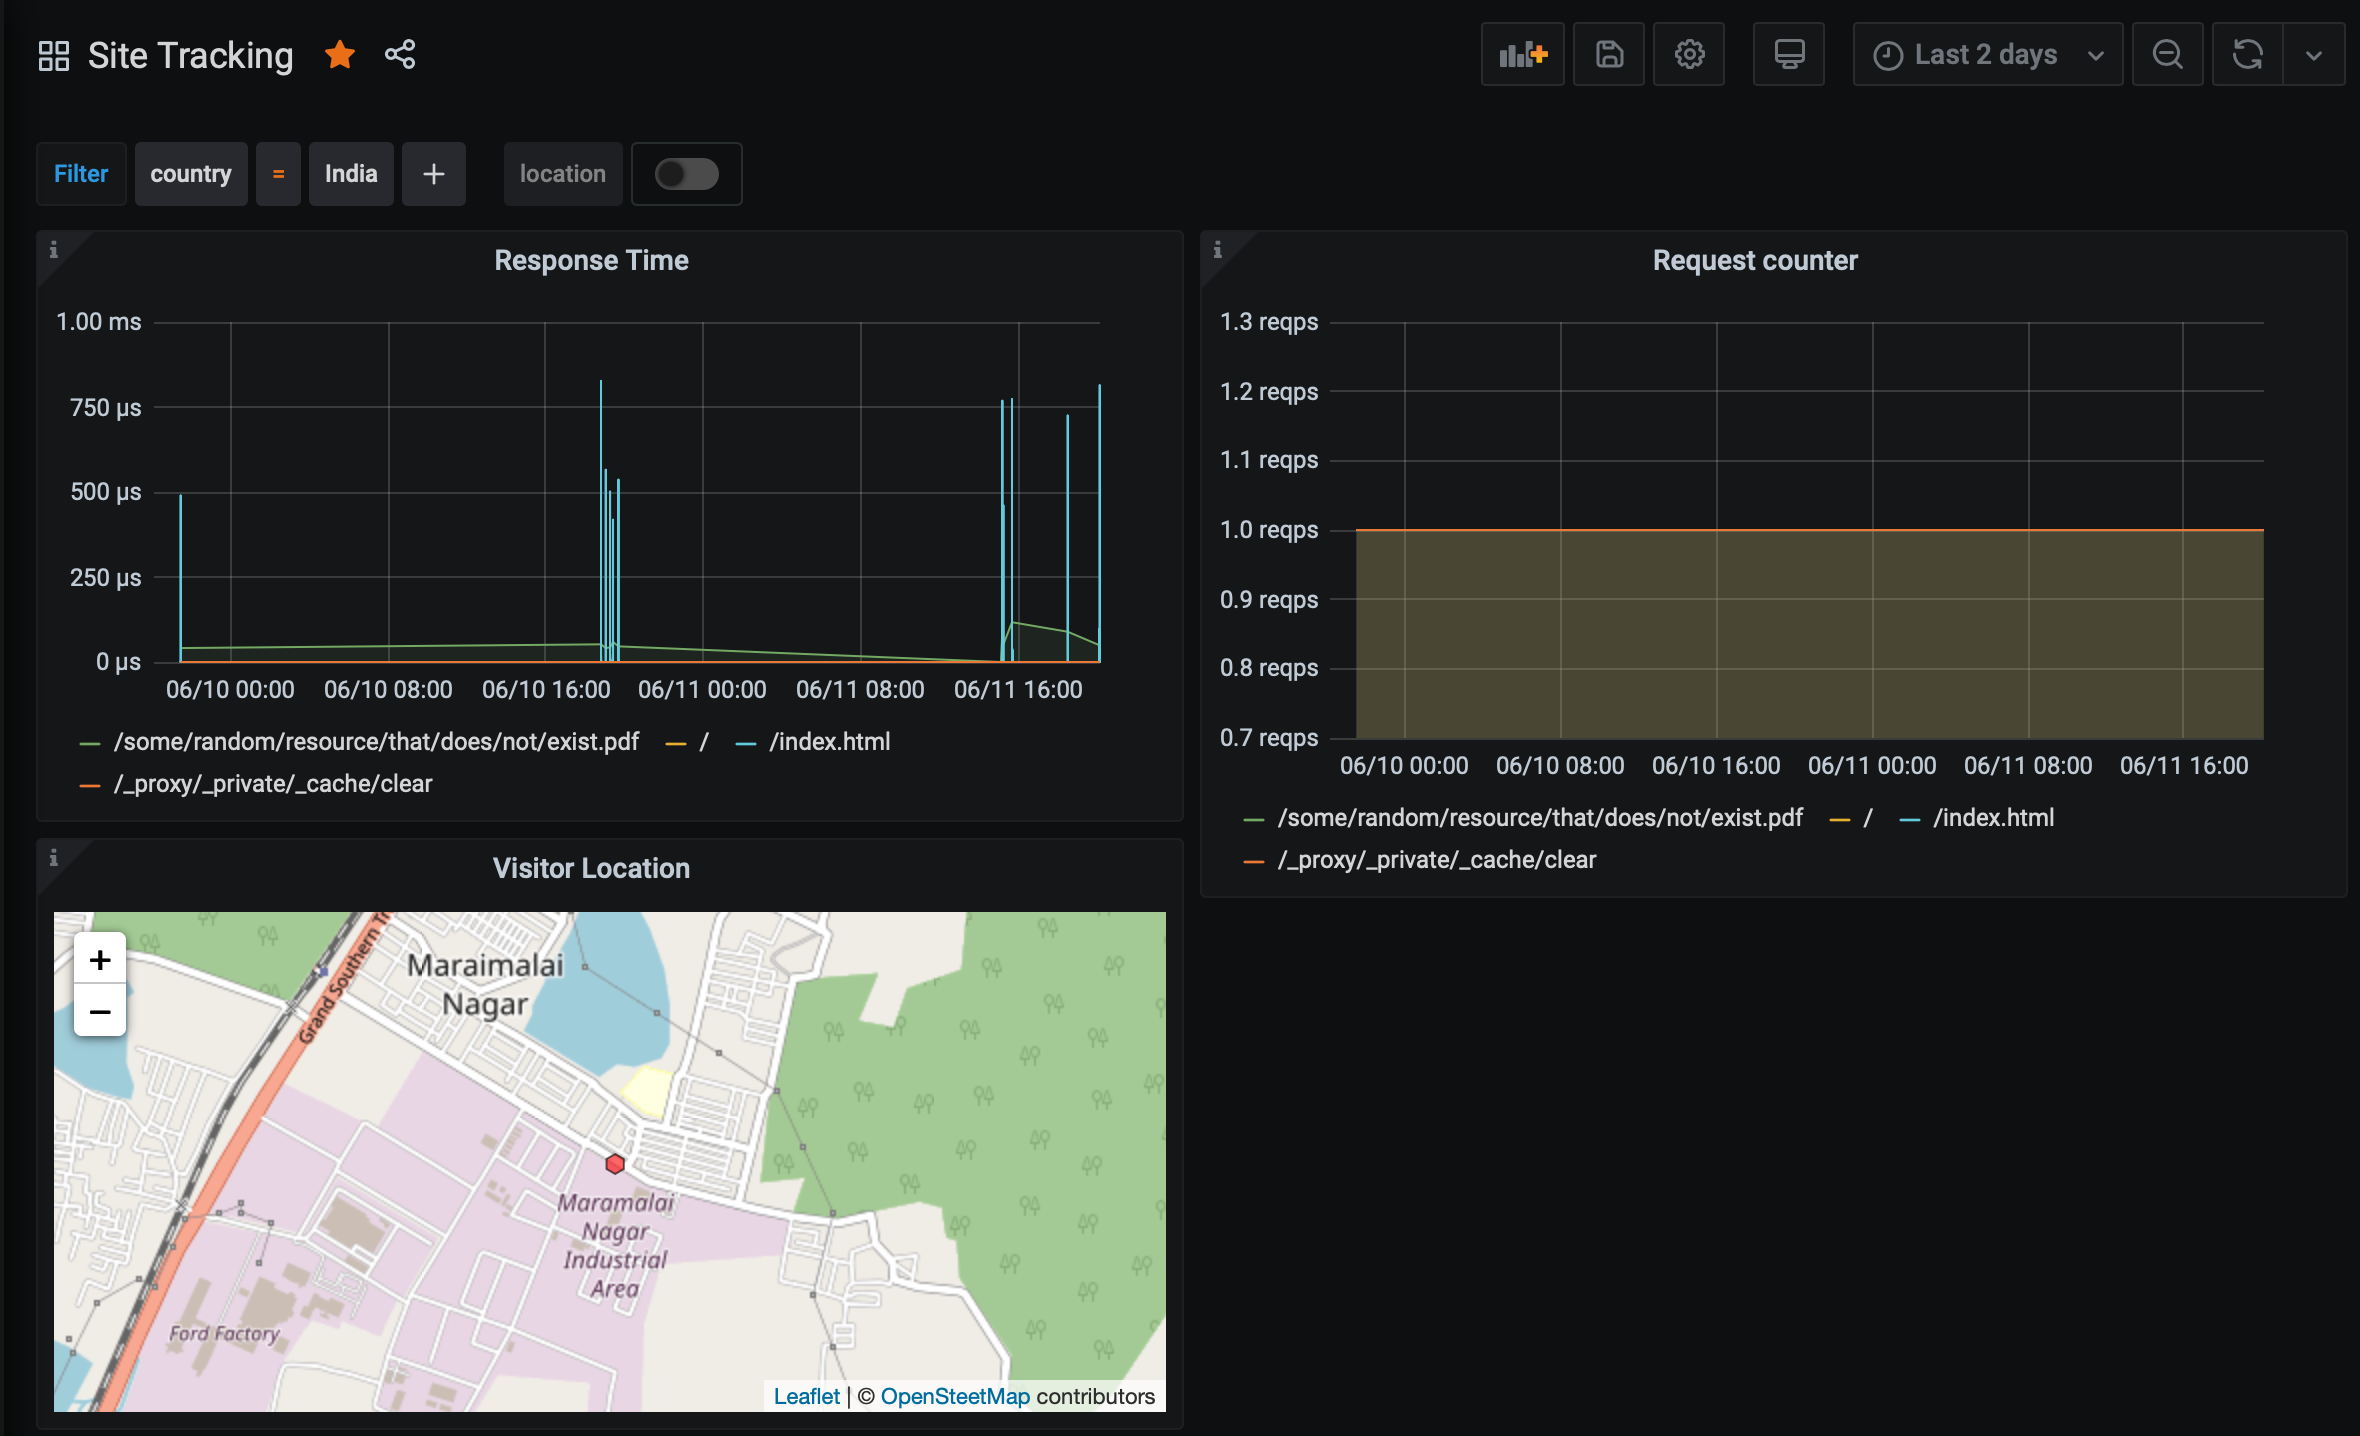
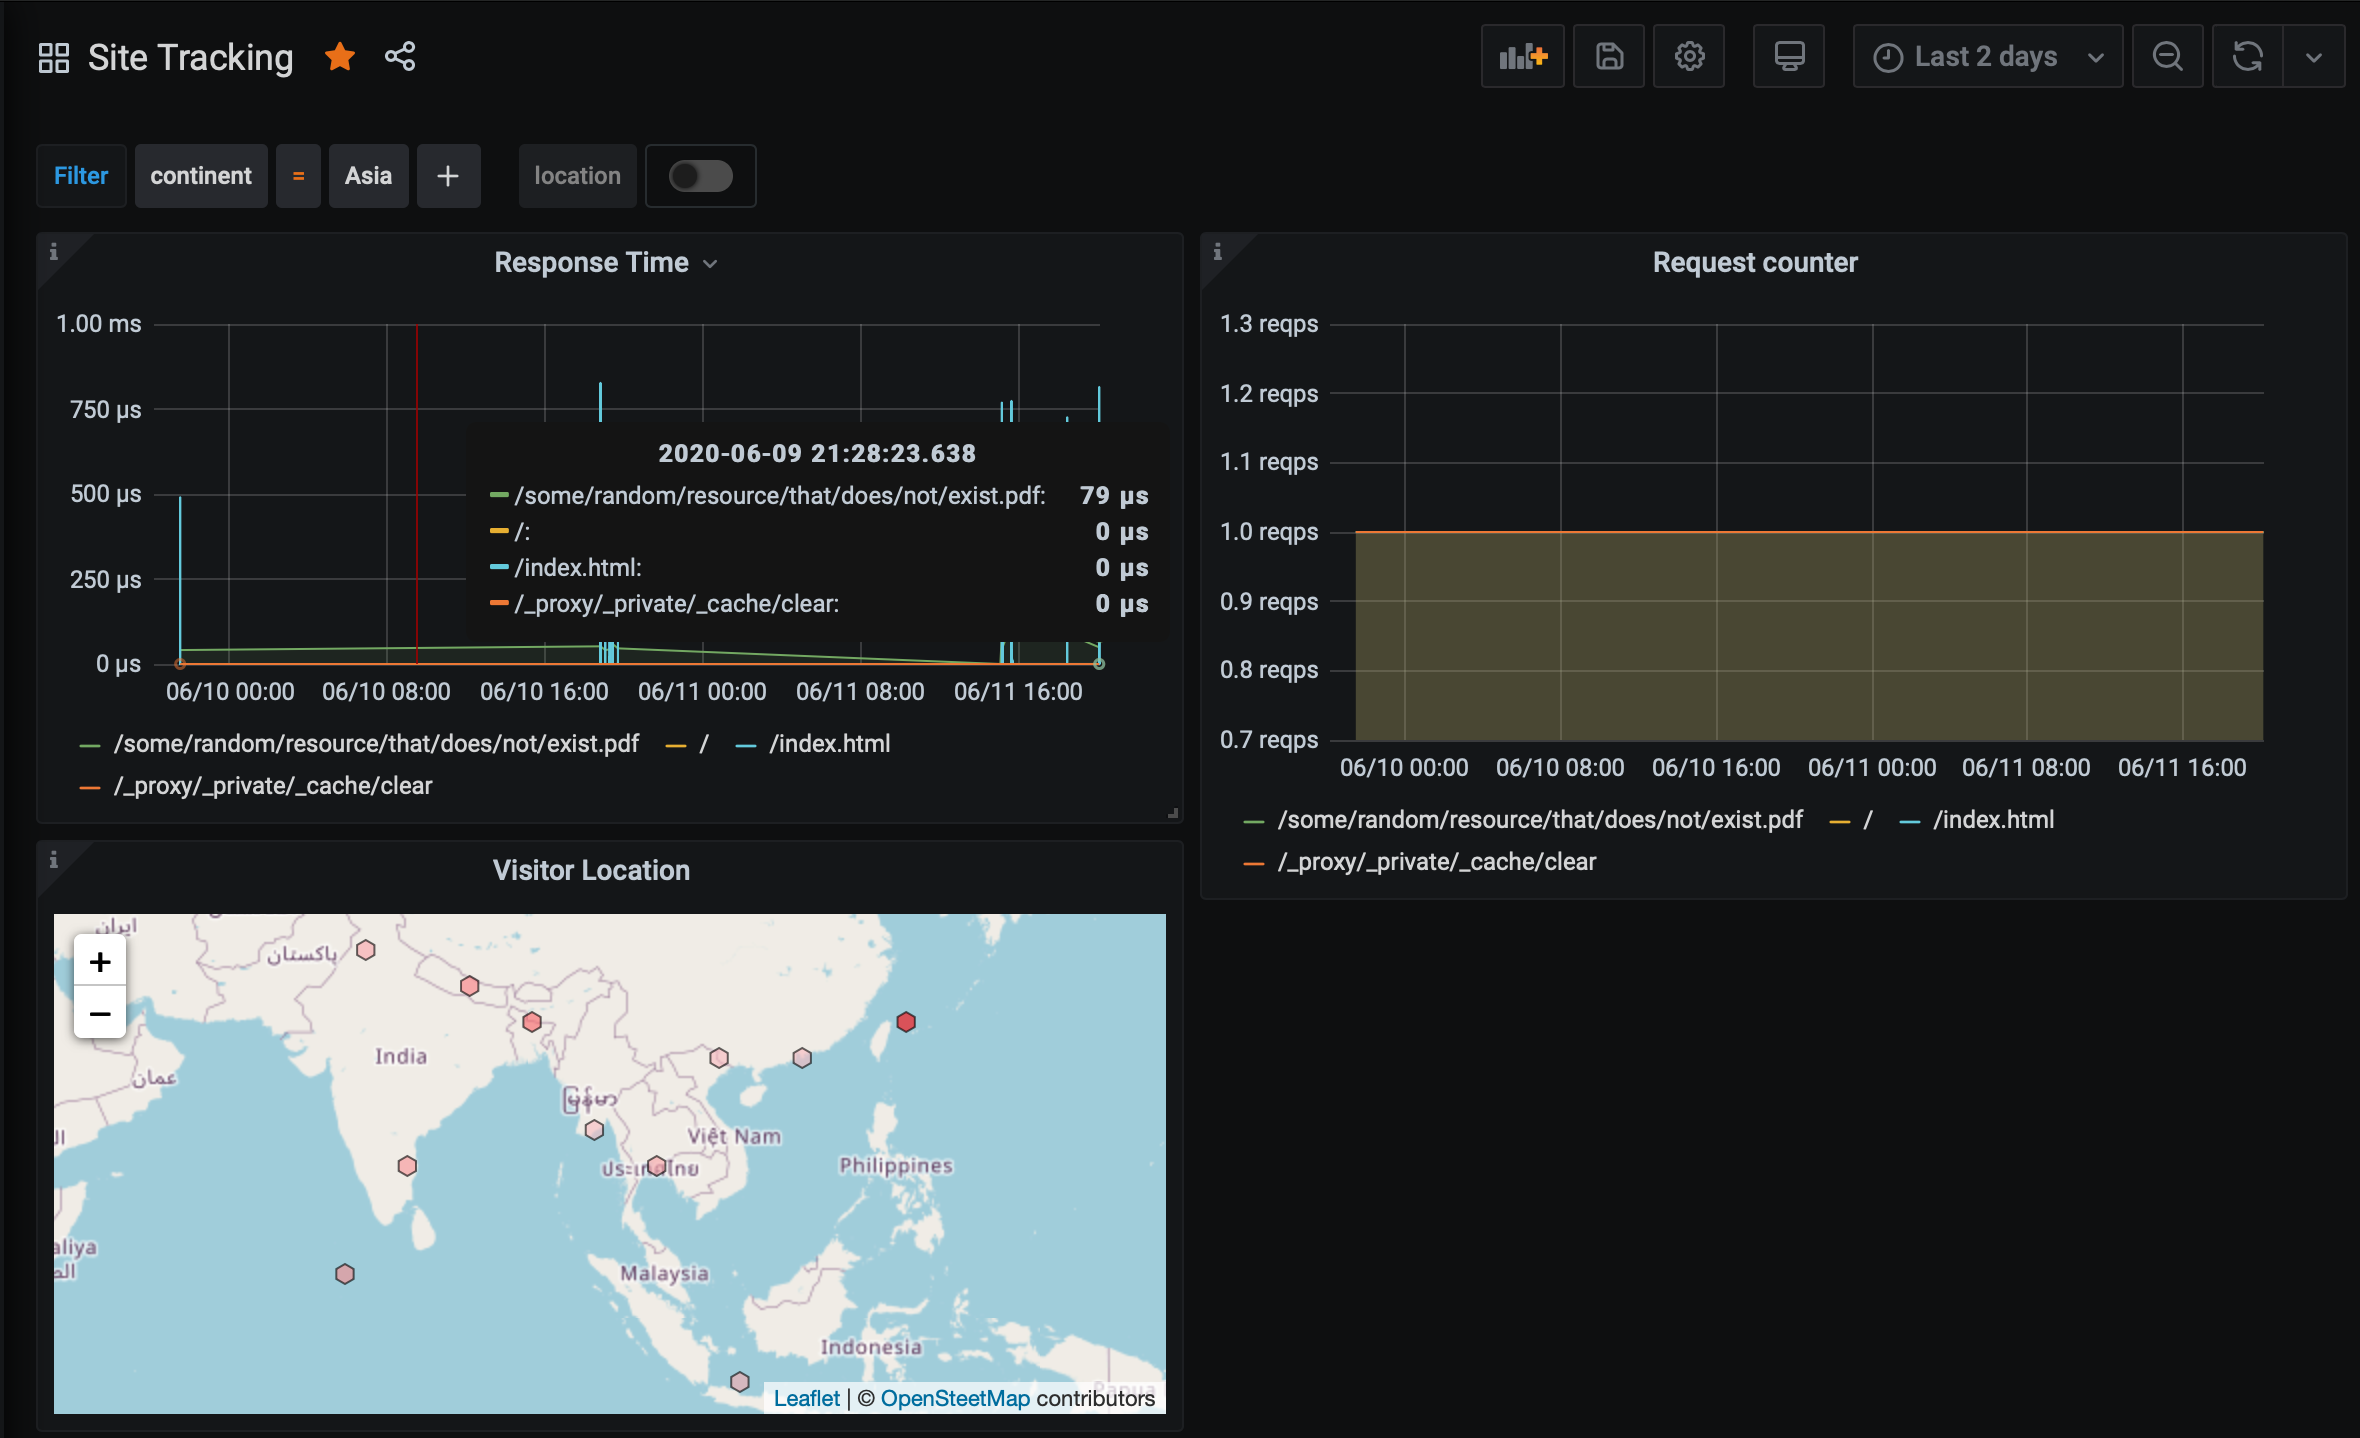
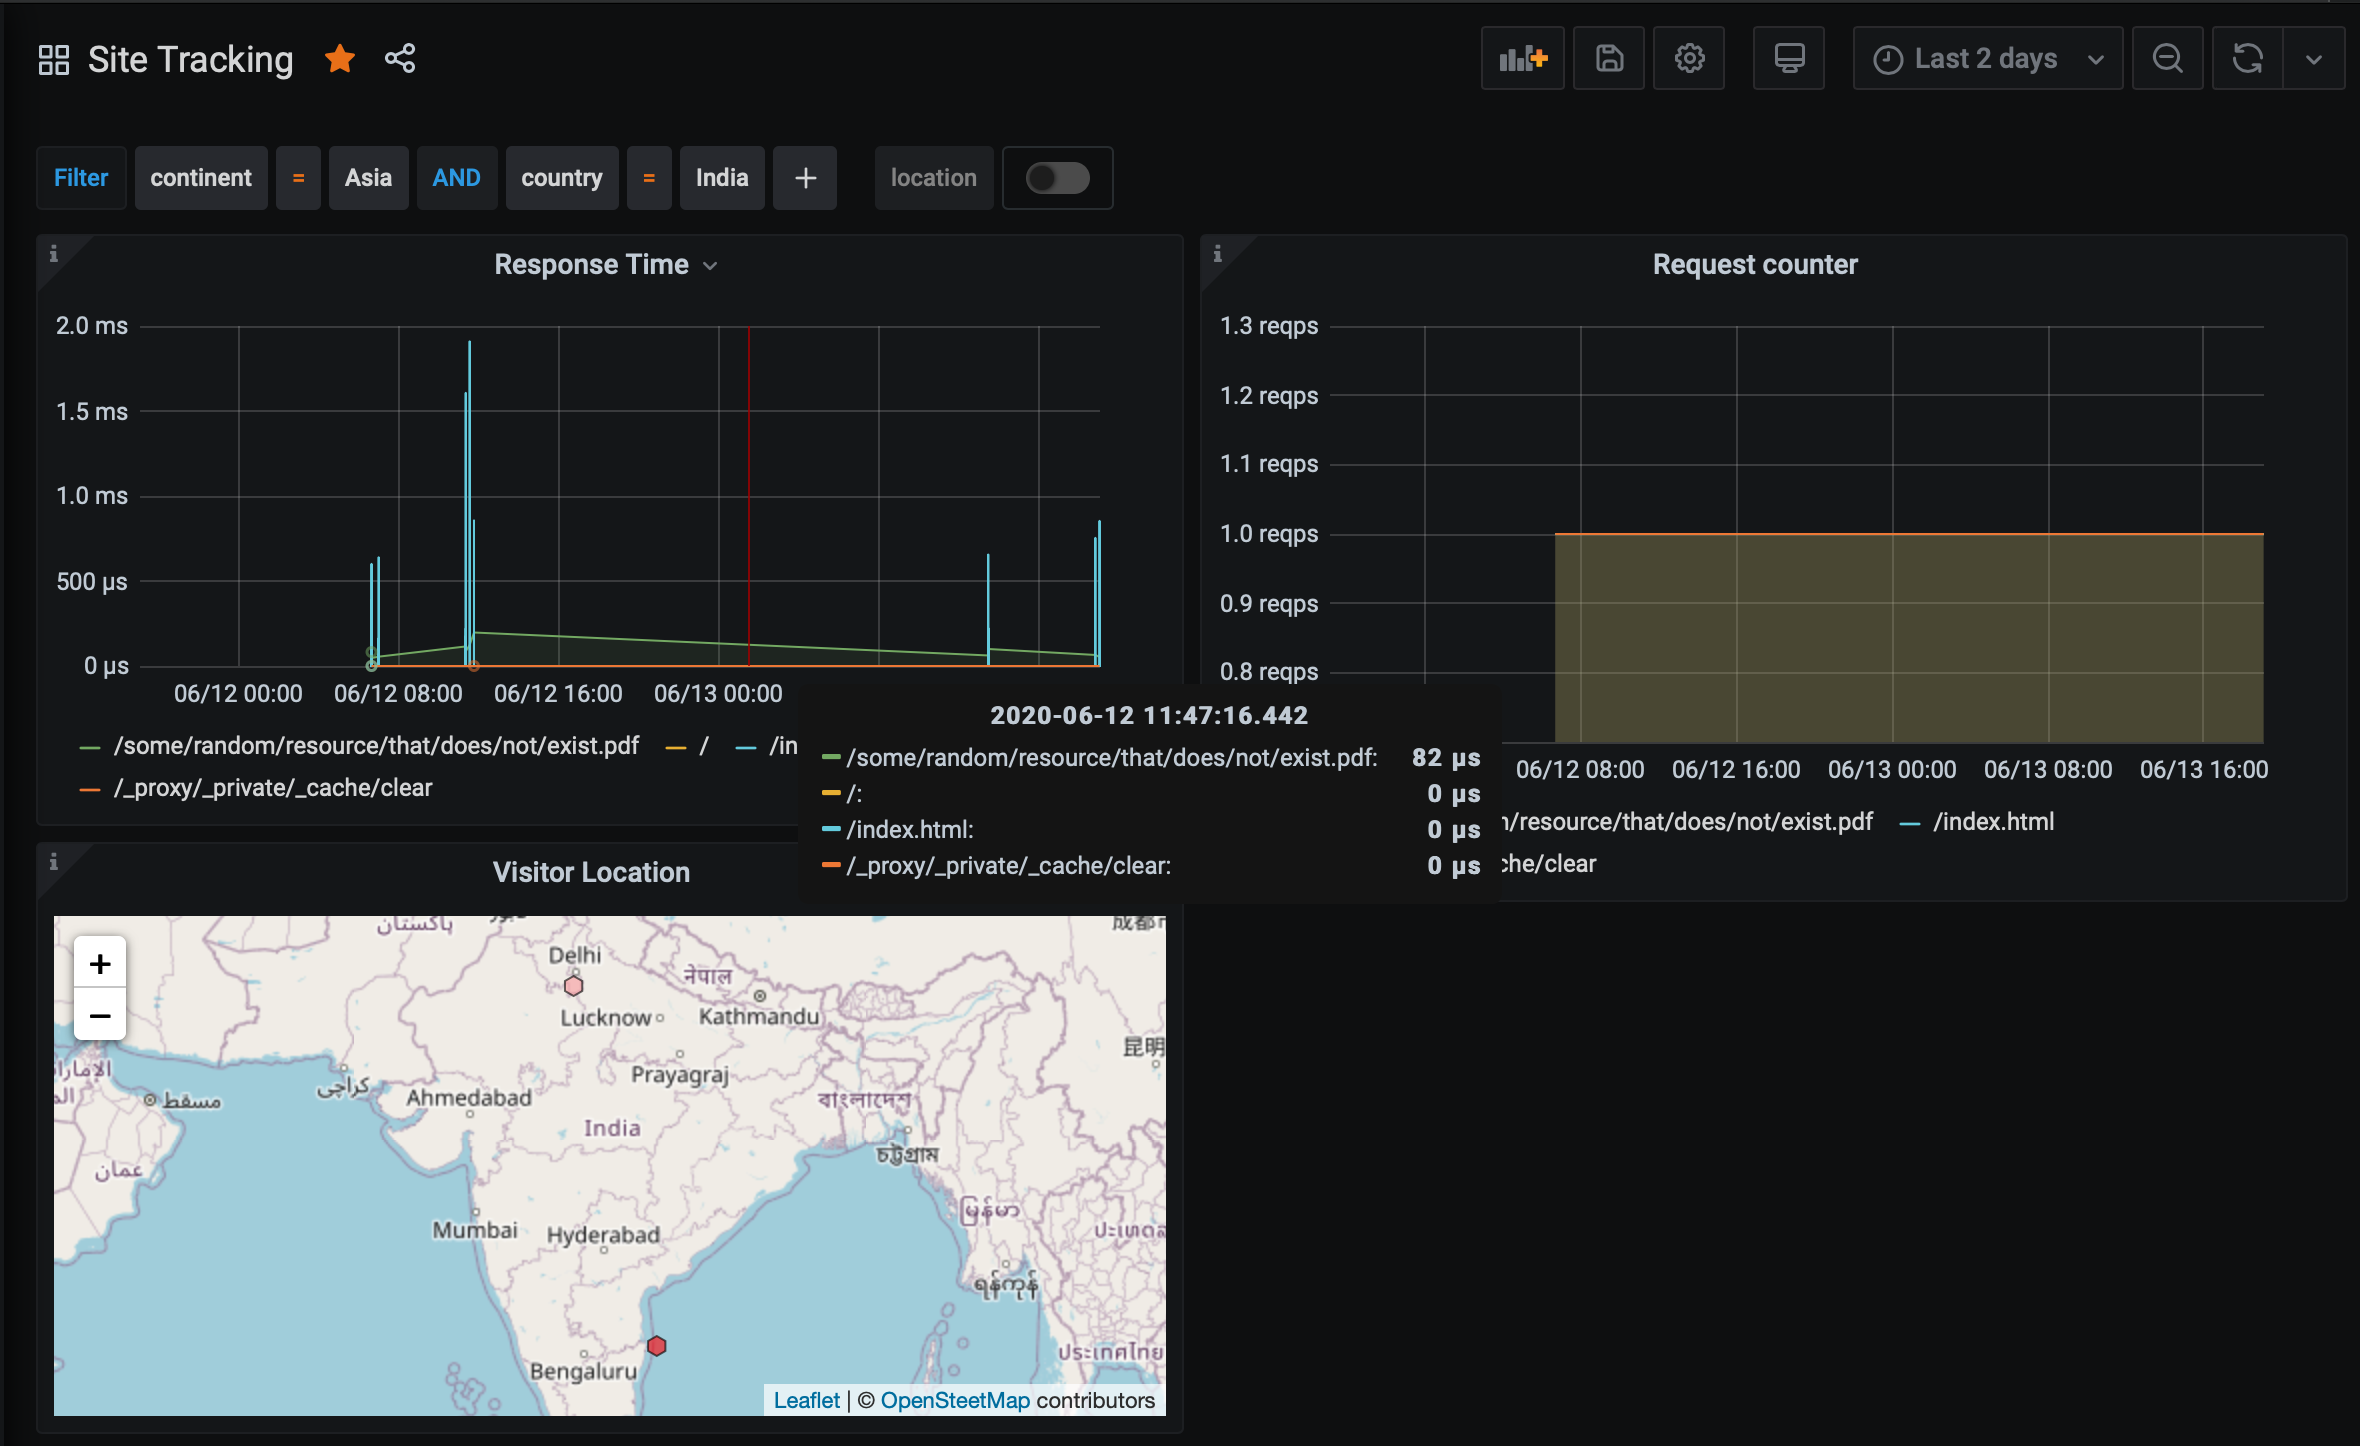
Additional filters may be applied via the adhoc filter mechanism. Assuming
that a dashboard variable was configured as documented earlier, we can apply
additional filters based on Akumuli series tags. Click the + button next
to the Filter option on dashboard and select an appropriate tag (handled
by the /tag-keys service endpoint). Select the value to filter by (handled
by the /tag-values service endpoint). The map panel will not be automatically
filtered by the adhoc query. You can add additional filters as appropriate
as illustrated by the sceen capture below.
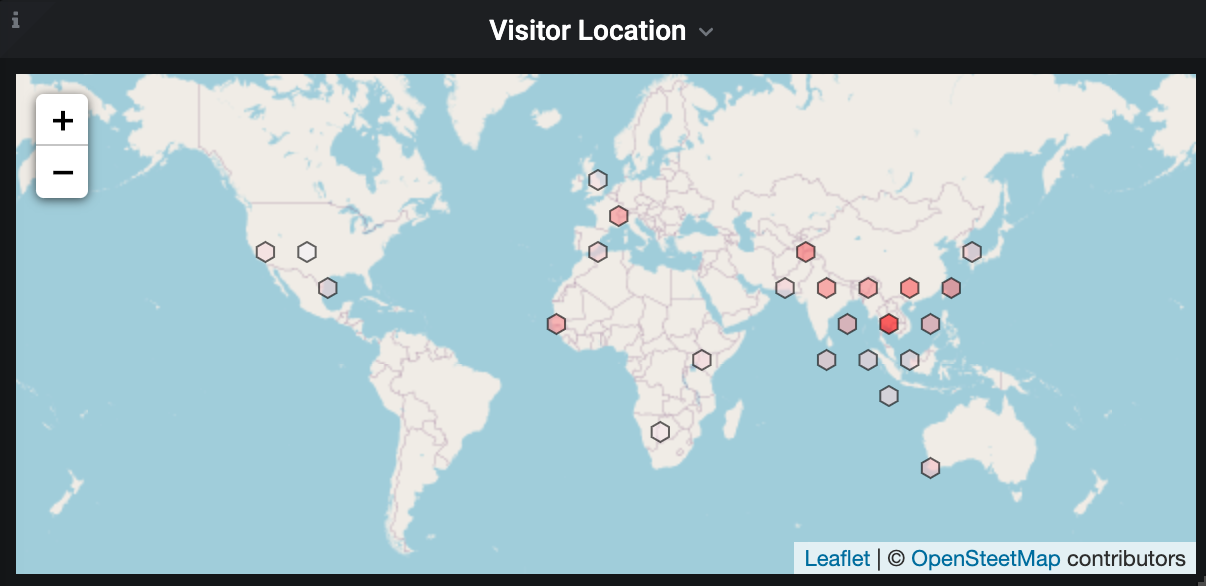
This service was developed to provide an insight into the geographic areas from which visitors access web sites/applications. In particular, this service is used in conjunction with the s3-proxy and mmdb-ws services to provide analytics related to visitors accessing front-end applications hosted from S3 buckets.
The server can be configured with the following options:
--port- The port on which the server listens. Default8020. When running as adockercontainer, specify the override using thePORTenvironment variable.--threads- Number of I/O threads for the server. Defaults tostd::thread::hardware_concurrency. When running as adockercontainer, override using theTHREADSenvironment variable.--akumuli-host- Host name for connecting to Akumuli. When running as adockercontainer, specify using theAKUMULI_HOSTenvironment variable.--akumuli-port- Port on which Akumuli query service listens. Default is8181. When running as adockercontainer, override using theAKUMULI_PORTenvironment variable.--metric-name- Default metric to match against for the optional/tag-keysand/tag-valuesendpoints. Grafana adhoc filters are applied at the dashboard level, and the requests do not contain any metric related information. If not specified, tag services will be disabled (return empty array).
This software has been developed mainly using work other people have contributed. The following are the components used to build this software:
- Boost:Beast - We use Beast for the
httpserver implementation. The implementation is a modified version of the async example. - Clara - Command line options parser.
- NanoLog - Logging framework used for the server. I modified the implementation for daily rolling log files.
- rapidjson - JSON parser for parsing request payload and response data from Akumuli.
