In this study, 3000 Twitter Users of all age groups, across the United States, were selected randomly for analysis. A total of 8.7 Million Tweets from those users were scrapped, and several attributes of the users were extracted by performing various analysis on the information posted in profile, their tweets, etc.
The following tools were used in the creation of our dataset to perform our analysis on:
- Tweepy API - To obtain the user attribute details posted by the users on their profile.
- snscrape API - To scrape random users and the past 3240 Tweets of each user from Twitter.
- Geopy API - To convert the Location provided in a User's profile into coordinates.
- uszipcode API - To convert location coordinates into zipcode and obtain demographic details such as Population, Population Density, Water Level, Median Income, Median housing price, etc. of that zipcode.
- LIWC Text Analyzer - It was used to obtain the intensity of various different tones present in the Tweets of each User.
- VADER Sentiment Analyzer - To obtain a sentiment score between 0 to 1, by processing all the Tweets of a User.
The following map shows the average Sentiment (Mental Health indicator) Distribution of Twitter Users across United States:
The following map shows the distribution of Users across United States:
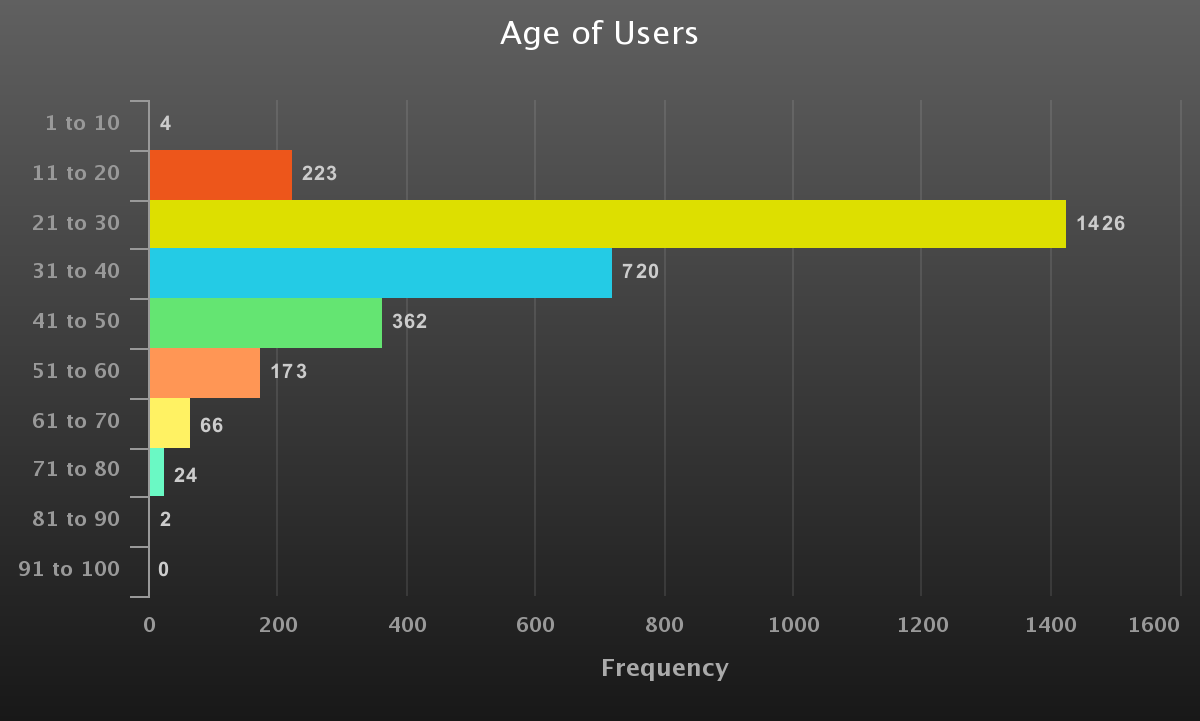
The following graph shows the age distribution of the mined Users:
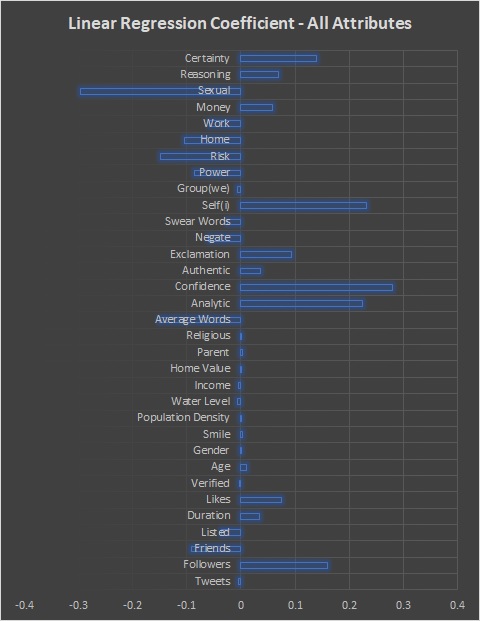
The following graph show the final result of the Study (i.e.) the attributes of the users which positively & negatively affect their mental health: Note: The bar on right side indicates a positive correlation of a trait with mental health, and a left side bar indicates negative correlation.
The Description of all Python Programs in this project are specified below (the programs must be executed in the below sequence):
- Final_User_Collection.py - Scraps for random Twitter Users, and filters the ones within United States with profile photo containing a single face, and saves the obtained User's attributes in the /User_Details directory, and the User IDs in the "All_Users.csv" file.
- freq_words_string_gen.py (reference only code) - Generates most common keywords for random search of Tweets (in Final_User_Collection.py), to scrape random English Users.
- random_user_sampler.py (reference only code) - Code snippet from 'Final_User_Collection.py', which samples random English speaking Users on Twitter.
- Tweets_Scrapping_snscrape-All_Users.py - Scrapes the last 3240 individual Tweets of all the (3000) user IDs present in the "All_Users.csv" file, and saves them in the /User_Tweets directory. Uses the Python mutiprocessing library for a very fast scrapping, and has resumability in case of intermittent program termination.
- Tweets_Scrapping_snscrape.py (reference only code) - Contains the code snippet, which extracts the last 3240 Tweets of just 1 specified Twitter user.
- User_Tweet_Counter.py - Counts the Tweets obtained from each user, and also calculates the avaerage tweets per month of each user to find their freqency of usage, and saves the results in 'Users_Count.csv' file.
- United_States.py - Finds the corresponding US State of each user from their zipcode, and save the State of each user to "User_Analysis/User_States.csv" file, and the distribution of users across states to the "User_Analysis/User_States.json" file.
- LIWC_Input.py - Reformats all the (8.7 Million) Tweets, and saves them into a single file 'LDA_Input/All_Tweets.csv', readable by the LIWC 2015 Text Analyser for Tone Detection. Note: The LIWC 2015 text analyzer must be run on the 'LDA_Input/All_Tweets.csv' file now.
- LIWC_Average.py - Copy & Rename the results obtained from LIWC 2015 to "LIWC_Results/LIWC2015_Results.csv", and run this program. The program will average the Tone values across all the tweets of each user, and provides 1 value per tone for each user. The final results are stored in the "LIWC_Results/LIWC_User_Results.csv" file.
- VADER_Sentiment_Final.py - Processes all the Tweets of All Users using VADER Sentiment Analyser, and assigns a sentiment score of 0 to 1 for all the users. The results are saved to "User_Analysis/VADER_Sentiment.csv" file.
- Parent_detection.py - Performs regular expression search on each User's Tweets and profile description, and classifies them as a parent if expressions such as "my/our ..(X)..year old/kid/son/daughter/child" is present in their tweets, or if roles such as parent/mother/father/mom/dad are present in the user description. Also people who had grandpa/grandma/etc. in their description were excluded from the parents list, since they won't have the financial responsibility of supporting their children at their age. The results will be saved in the "User_Analysis/Parent_Status.csv" file.
- Religion_detection.py - Performs regular expression search, and searches just for the word pray/praying in the Tweets to classify if the person is religious or not. In addition when words such as god/jesus/pray are included in the profile description, the users were classified religious, and if words such as atheist/no god are present in the description, the user was classified as not religious. The results are saved to the "User_Analysis/Religious_Status.csv" file.
- duration_likes_per_month.py - Obtains age of User's account, by using it's creation date, and also calculates the average number of likes per month made by the user, since the account creation. The results are saved in the "User_Analysis/duration_likes_per_month.csv" file.
- Final_CSV_Compilation.py - The final code that compiles all the dataset required by the Linear Regression Model, from the files created by the previous program, and stores the dataset in the "Linear_Regression/User_Attributes.csv" file.
- Final_CSV_Normalization.py - Performs the final normalization step on the dataset, to callibrate the values within 0 to 1, for training the Linear Regression model. This program normalized all the contants of the "Linear_Regression/User_Attributes.csv" file, and saves them in the "Linear_Regression/Normalized_Attributes.csv" file.
- Linear_Regression.py - Performs the Linear Regression training, by reading the dataset from "Linear_Regression/Normalized_Attributes.csv" file, and the calculated VADER Sentiment from "Linear_Regression/VADER_Sentiment.csv" file. Now the weights of the model (Linear Regression Coefficients), which contain the information about which attribute is positively/negatively correlated with the mental health of a User, is saved to the "Linear_Regression/Full_weights.csv" file.
- VADER_Heatmap.py - Calculates the average sentiment of each US State, and saves the distribution in the "User_Analysis/User_State_Sentiments.csv" file.
- States_Heatmap.py - Finds the distribution of our mined users across the US States, and saved the distibution in the "User_Analysis/User_State_Distribution.csv" file.
- ttest_histogram.py - Creates & displays a histogram and ttest comparision analysis, beween users falling in lower and higher spectrum of any selected attribute. The index (column number minus 1) of the attribute as in the "Linear_Regression/Normalized_Attributes.csv" file, needs to be set in the "test_index" global variable.
- Scatter_Plot.py - Plots the scatter plot between users falling in the lower and higher spectrum of the given attribute. The "test_index" global variable needs to be set in the same method as in the 'ttest_histogram.py' program.

