This repository holds the miscellaneous R scripts I wrote. Please note that these scripts as provided such and execute appropriate precaution in using them. You can better them and share them with the community. At first these scripts are R scripts. Eventually I will move them to Rmark up.
Scripts:
-
Volcano plot using ggplot2.Rmd - This script is for volcano plots in ggplot2 and basic R plotting for highlighting genes/points of interest
-
salmon_deseq2 workflow.Rmd - This script is analyzing Salmon output using DESEQ2 R library. Output from Salmon output should be in a folder by name "results" and the transcript mapping file should be in "reference" folder. Script (salmon_deseq2 workflow.Rmd), results folder and reference folder should be in the same folder. Output from the analysis (salmon_deseq2 workflow.Rmd output) will be stored in a separate folder (salmon_deseq2_results_results) in results folder. User should edit the sample names and subsequent processing by hand. This script, will generate DE genes, produces DESEQ2 results report in html and pdf format. In addition, same information is captured in a separate pdf. User can edit the params to get optimal images.
-
wasabi_sleuth_workflow.Rmd - This script is analyzing Salmon output using Wasabi and Sleuth R libraries. Output from Salmon output should be in a folder by name "results" and the transcript mapping file should be in "reference" folder. Script (wasabi_sleuth_workflow.Rmd), results folder and reference folder should be in the same folder. Output from the analysis (wasabi_sleuth_workflow.Rmd output) will be stored in a separate folder (sleuth_results) in results folder. User should edit the sample names and subsequent processing by hand. This script, will generate DE genes.
-
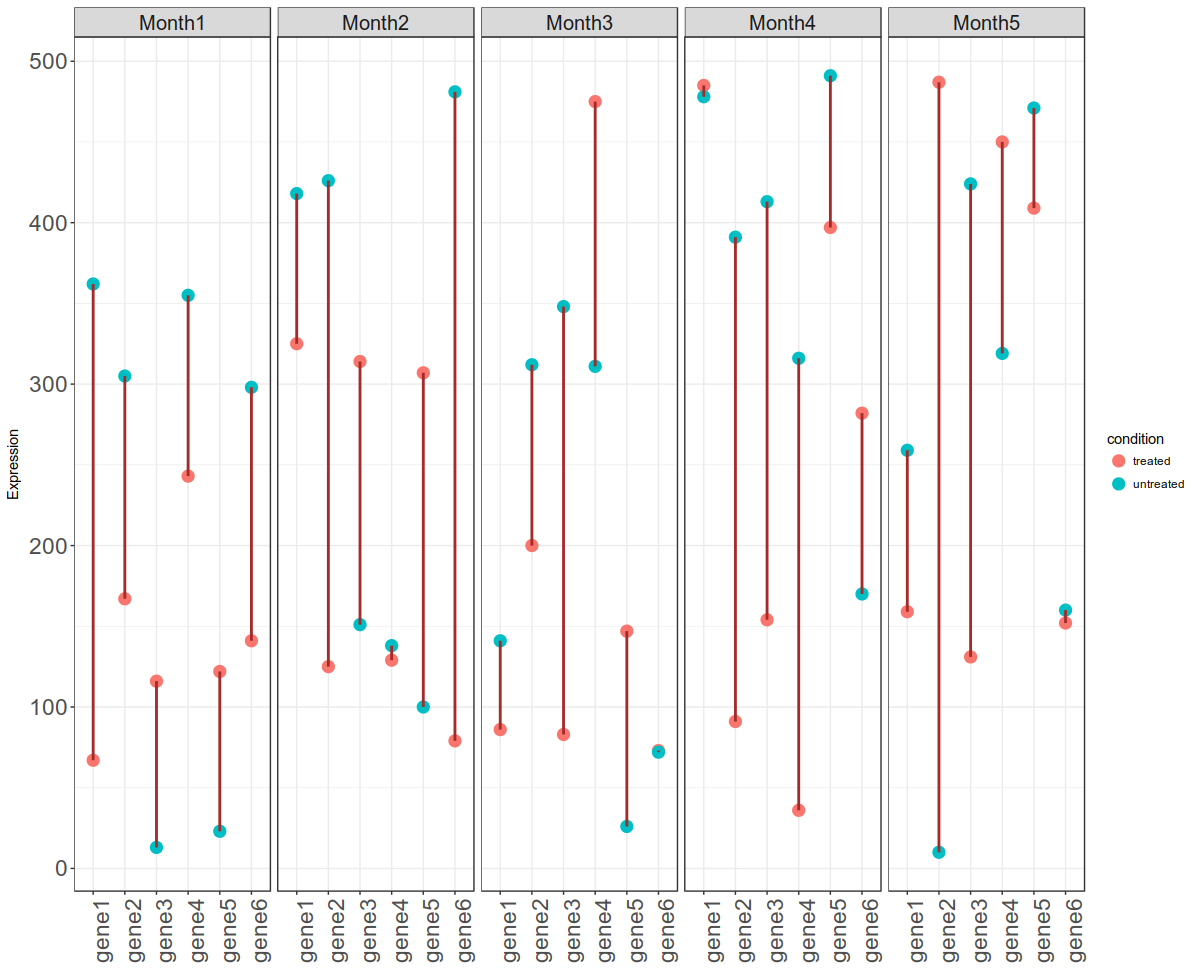
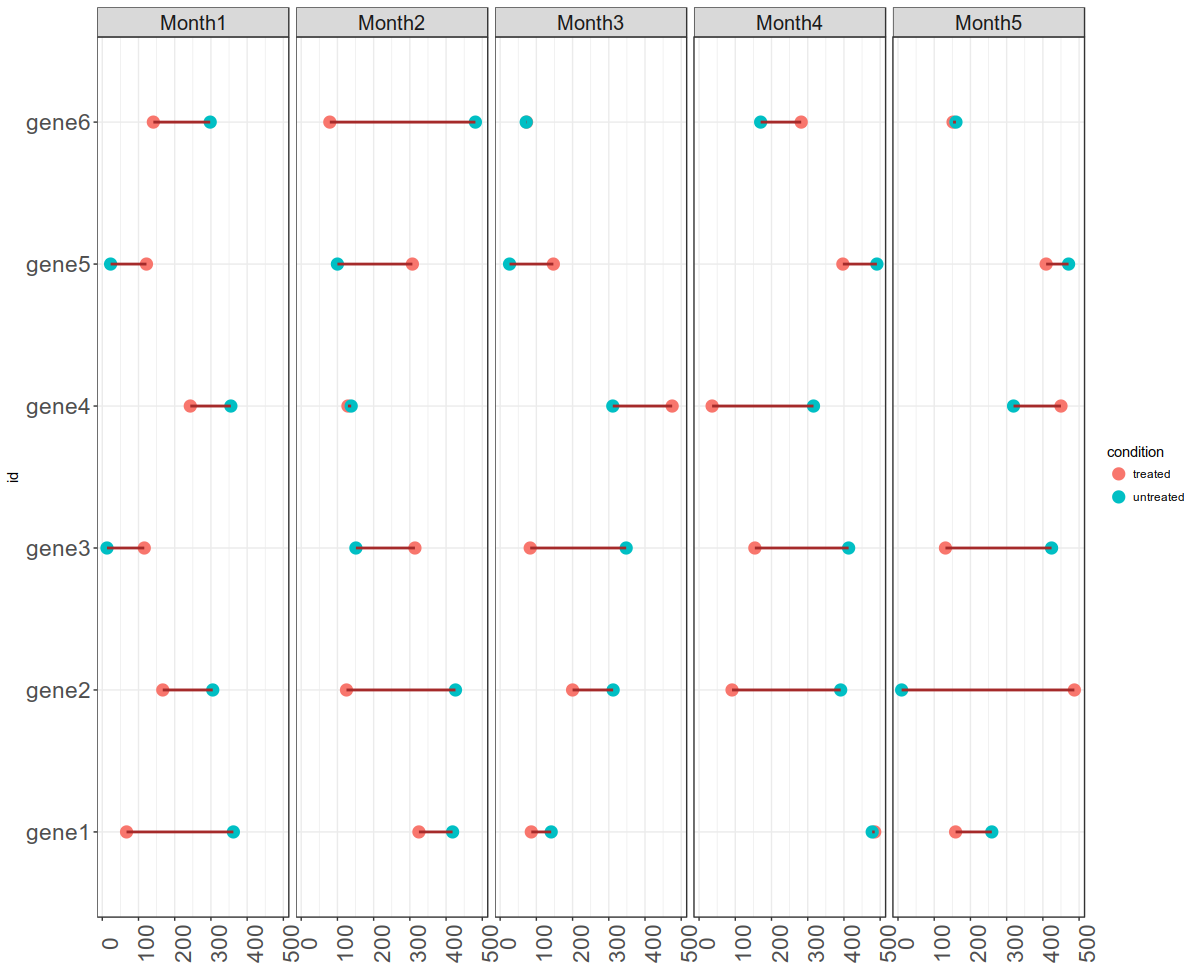
time_series_ggplot_30052018.Rmd - This script is for plotting time series gene expression data with two conditions (treated vs untreated). You can view the output below:
-
average_triplicates.Rmd. This script averages (mean) triplicate columns. Format for triplicates is samplename_timepoint_Replicatenumber (for eg. X_T0_R1,X_T0_R2,X_T0_R3 - 3 replicates for time 0 for x, X_T1_R1,X_T1_R2,X_T1_R3 - three replicates for time 1 for x)
-
average_triplicates_collapse_duplicates.Rmd: This script averages (mean) triplicate columns and collapses (by mean) duplicate rows.
-
multiple_facet_grid.Rmd - This script has gene expression data with two categories as covariates represented by ggplot. The graph has per gene, per condition, per gender faceting graphical representation.
-
group_specific_mean_ggplot.ipynb - This script has ggplotting per group (factor/categorical variable) mean coloring cutoffline. In general, ggplot mean drawing on ggplot with multiple groups is overall mean, instead of per group mean. This script allows highlighting points per group.
-
facet_sample_gene_R.ipynb- This script has two kinds of scripts within it: --One: plotting group means and connecting them by a line per sample per time for cumulative gene expression and plotting group means and connecting them by a line per gene per time. --two: Plotting heatmap of expression value. Final figure one is bad in the code as drawing within jupyter-notebooks, i havent' mastered. Final figure second one is good. Final figure one is as
-
Replace_gene_symbols_with_entrez_ids.ipynb - This script relaces all gene symbols in data frame with NCBI entrez IDs.
-
ggpairs_list_faceting_saving.Rmd - This script would create ggpairs graph list, save each one into individual file and facet them.
-
look_around_R_20072018.ipynb - This script uses lookaround functions in R to separate greek letters and english words in a single string
-
Heatmap_boxplot_clustering.ipynb - This script is about drawing a heatmap with column and row annotations with boxplot, violin and density plots as annotions and column color annotation.
-
Rowwise t test folder contains an example file and a function to run simple row wise t tests. Function takes one matrix, start and end columns of first group. Rest columns are automatically assigned to be second group.
-
append_filenames_to_column.R runs on a directory (path) with csv files and appends each csv file name to all the columns within that file. Please change the input directory (path) before you use this script.