Visualize Point Density
Overview
Visualize point density of the point cloud.
Usage
=================================
     Visualize Point Density
         Tomomasa Uchida
           2021/02/06
=================================

  USAGE:
  vpd [input_file] [output_file] [max_value_adjustment_ratio] [colormap_type]

  EXAMPLE:
  vpd input.ply output.spbr 0.8 -v

   [max_value_adjustment_ratio]
    0.8: new_max_value = max_value * 0.8
    1.0: no change.

   [colormap_type]
    -v: Viridis
    -p: Plasma
    -i: Inferno
    -m: Magma
    -c: Cividis
Example
$ sh config_vpd.sh
$ make
$ make install
$ make test_vpd
Bounding Box:
Min: 0.0492606 0.0509949 0.103085
Max: 0.52798 0.525888 0.474338
Number of points:
500018
ColorMap:
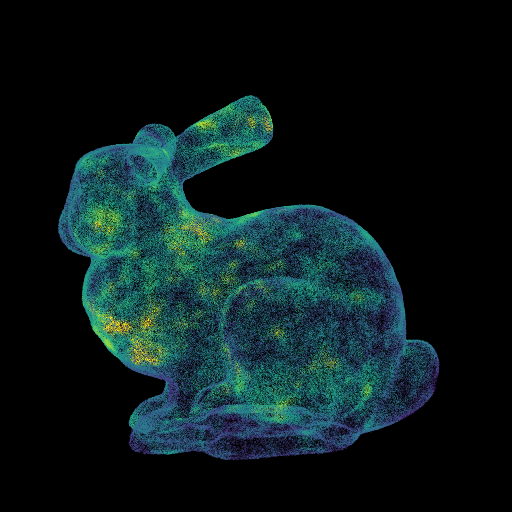
Viridis
Diagonal length of BB:
0.769756
Input divide value ( search radius = diagonal length / divide value ): 100
search radius: 0.00769756 ( = 0.769756 / 100 )
Now Octree Searching...
Done Octree search! ( 3.55287 [sec] )
Point density statistics:
Min: 15
Max: 509
Max value was adjusted:
Min: 15
Max: 407
Point density was normalized:
Min: 0.036855
Max: 1.00049
Writing spbr file (./out_viridis.spbr)...
Done writing spbr file! ( 1.15244 [sec] )
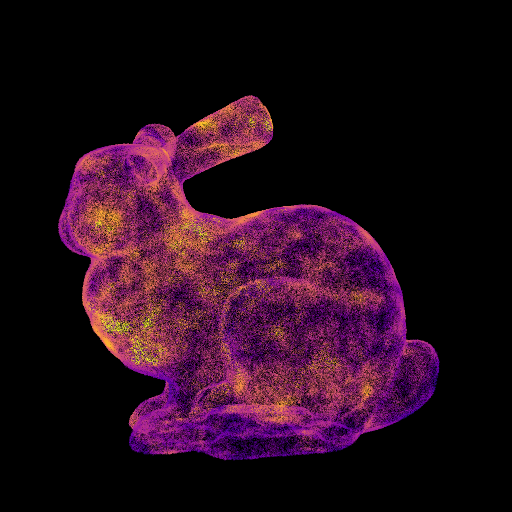
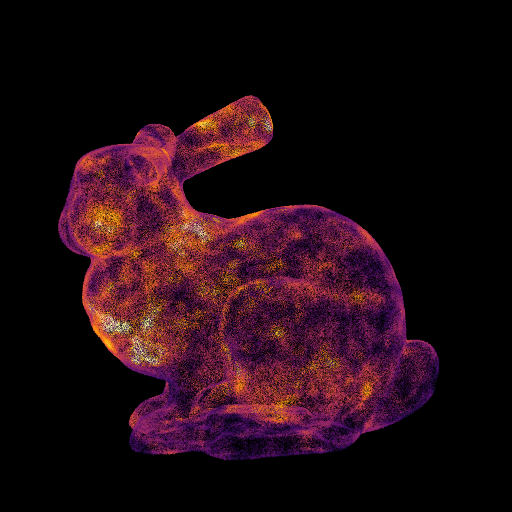
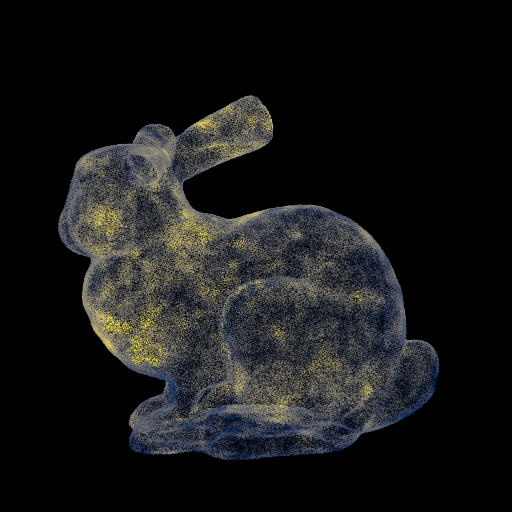
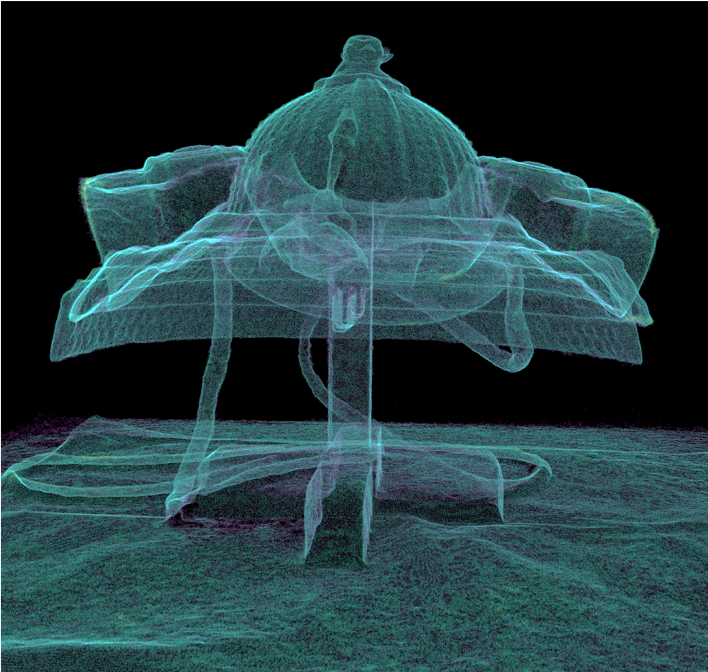
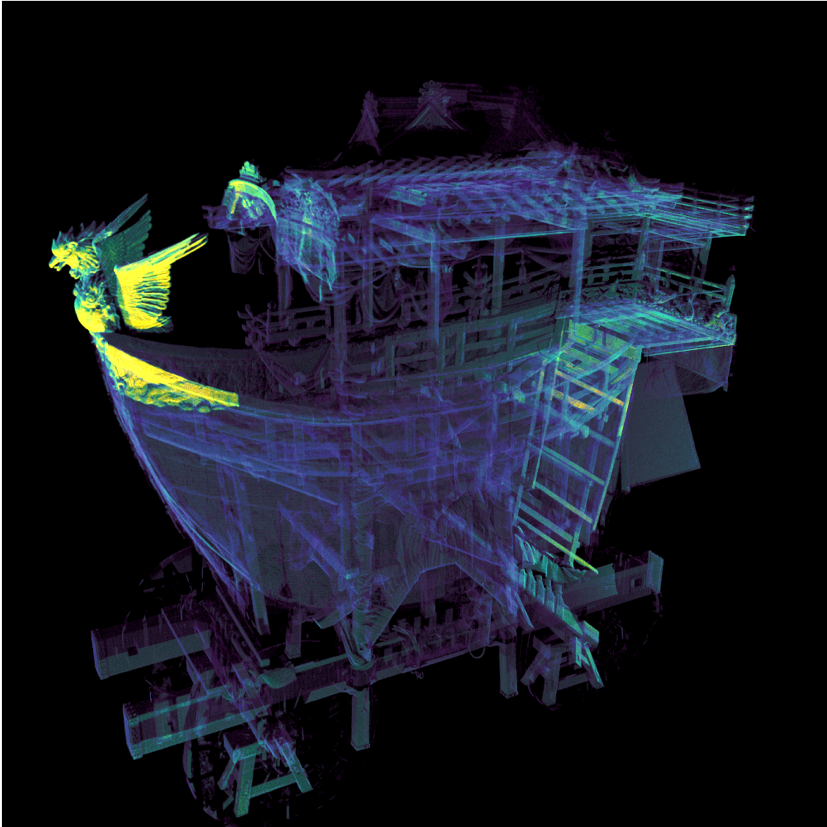
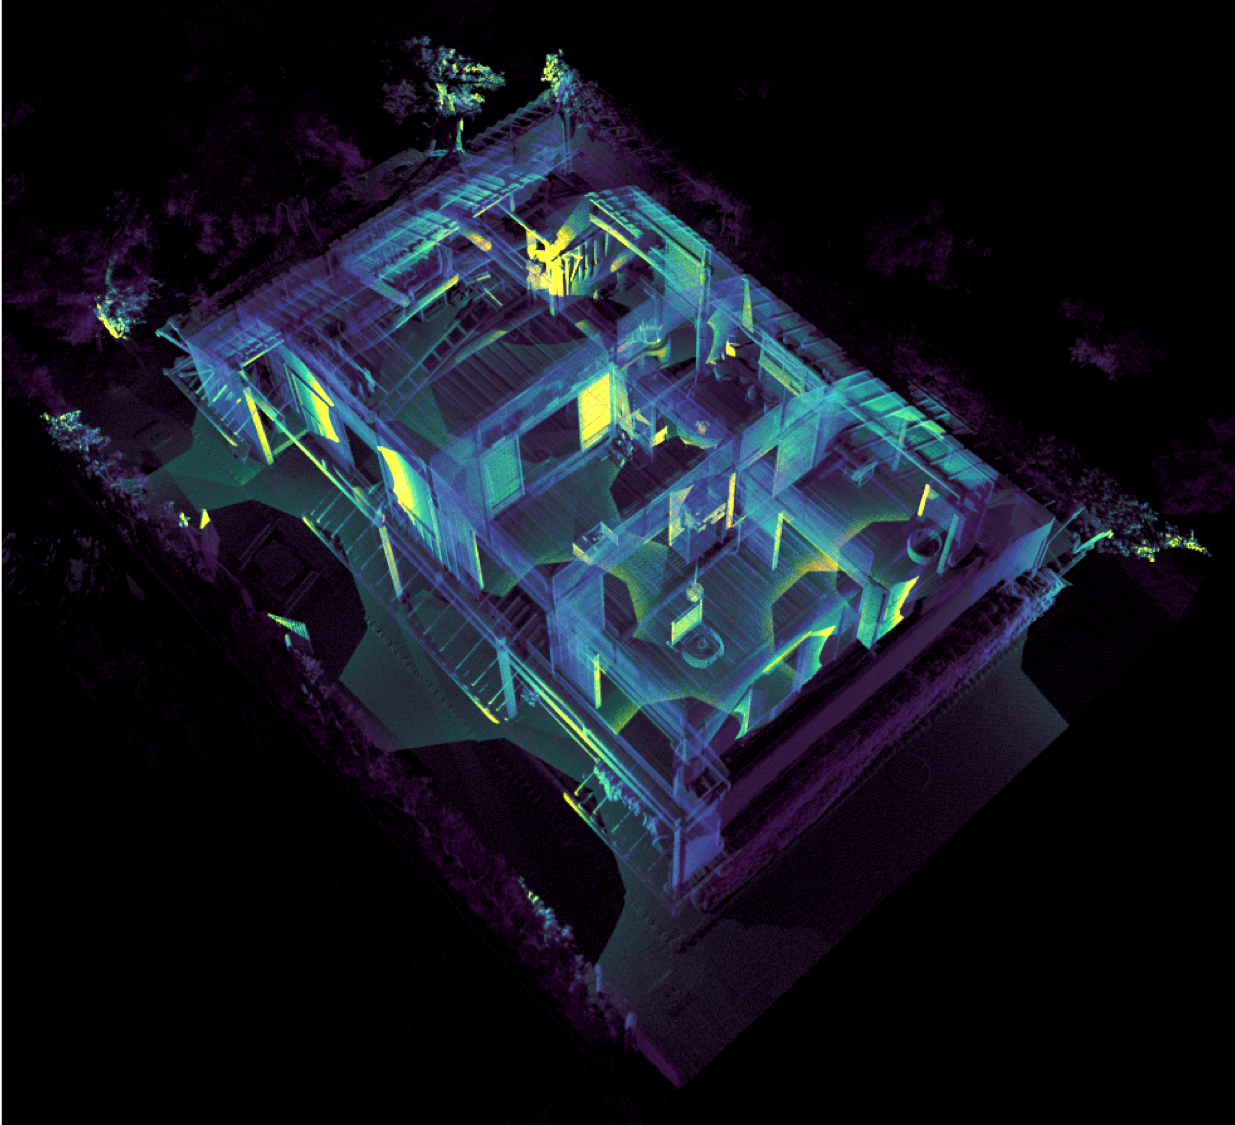
Visualization Results
| Viridis |
Plasma |
Inferno |
Magma |
Cividis |
 |
 |
 |
 |
 |
| Ookabuto |
Fune-hoko float |
Borobudur |
 |
 |
 |


