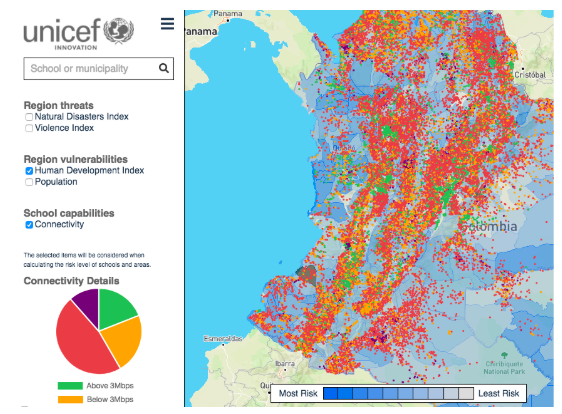
This application is designed to suggest schools and regions most in need of infrastructure and planning for disaster prevention and response. It is the product of an 8 week collaboration between UNICEF Innovation and Red Hat Innovation Labs. It is still a prototype.
This short video provides more detail
The app visualizes:
- schools as clickable data points colored by their level of connectivity to the internet
- regions as polygons colored by various population and various risk indicators
To help us generate and display new insights, follow the guide below to pick up new tasks and communicate with UNICEF developers.
Get started:
- Fork the project to your GitHub account and clone it.
- Copy
.env.local.sampleto.env.local.
- The school data included in this file is a small, "fake" data set for development use. To use the full data set (If you have permission to access it), change the
REACT_APP_SCHOOLS_URLvariable in .env.
- Run
npm install; npm start. - Pick an issue. To get more context about a requested feature, leave a comment in the issue, or come chat with us in our gitter channel.
- Create feature branch. When done create pull request to development branch of this repository.
Here is a contribution guide to Magic Box repositories.
For more information on getting started, see the create-react-app guide.
We are using the development branch as the main development branch for work on Magic Box Maps 2.0. Our development environment is deployed from this branch. Feature branches can be branched from development and merged back up when ready.
The public/data/schools.json file does not contain real schools as that may be sensitive information. Instead, we use a collection of around 60k points of interest located around Colombia.. The full data set is available in the private magicbox-data repo.
Warning: While we believe the population and human development index is accurate, the violence and natural disaster data is not, and we are working to improve the quality.
In the root of this project directory is a Dockerfile which can be built to deploy to a container platform (or testing locally). To build the image run the following command:
docker build -t unicef/magicbox-map .
With this image you can run it locally by running:
docker run -p 80:8080 unicef/magicbox-map
When building on a container platform, be sure to set the environment variables before building. You can set the environment variables in the build container, or you can pass the variables to the docker build command:
docker build -t unicef/magicbox-map . \
--build-arg REACT_APP_SCHOOLS_URL=/data/schools.json \
--build-arg REACT_APP_SHAPES_URL=/data/mpio-hdi-pop-threats-violence.json
When adding a new environment variable, remember to include it in:
- The JavaScript file where it's actually used (probably
api-config.js) - The Dockerfile
- This readme
To find out which environment variables are in use, see .env.local.sample.


