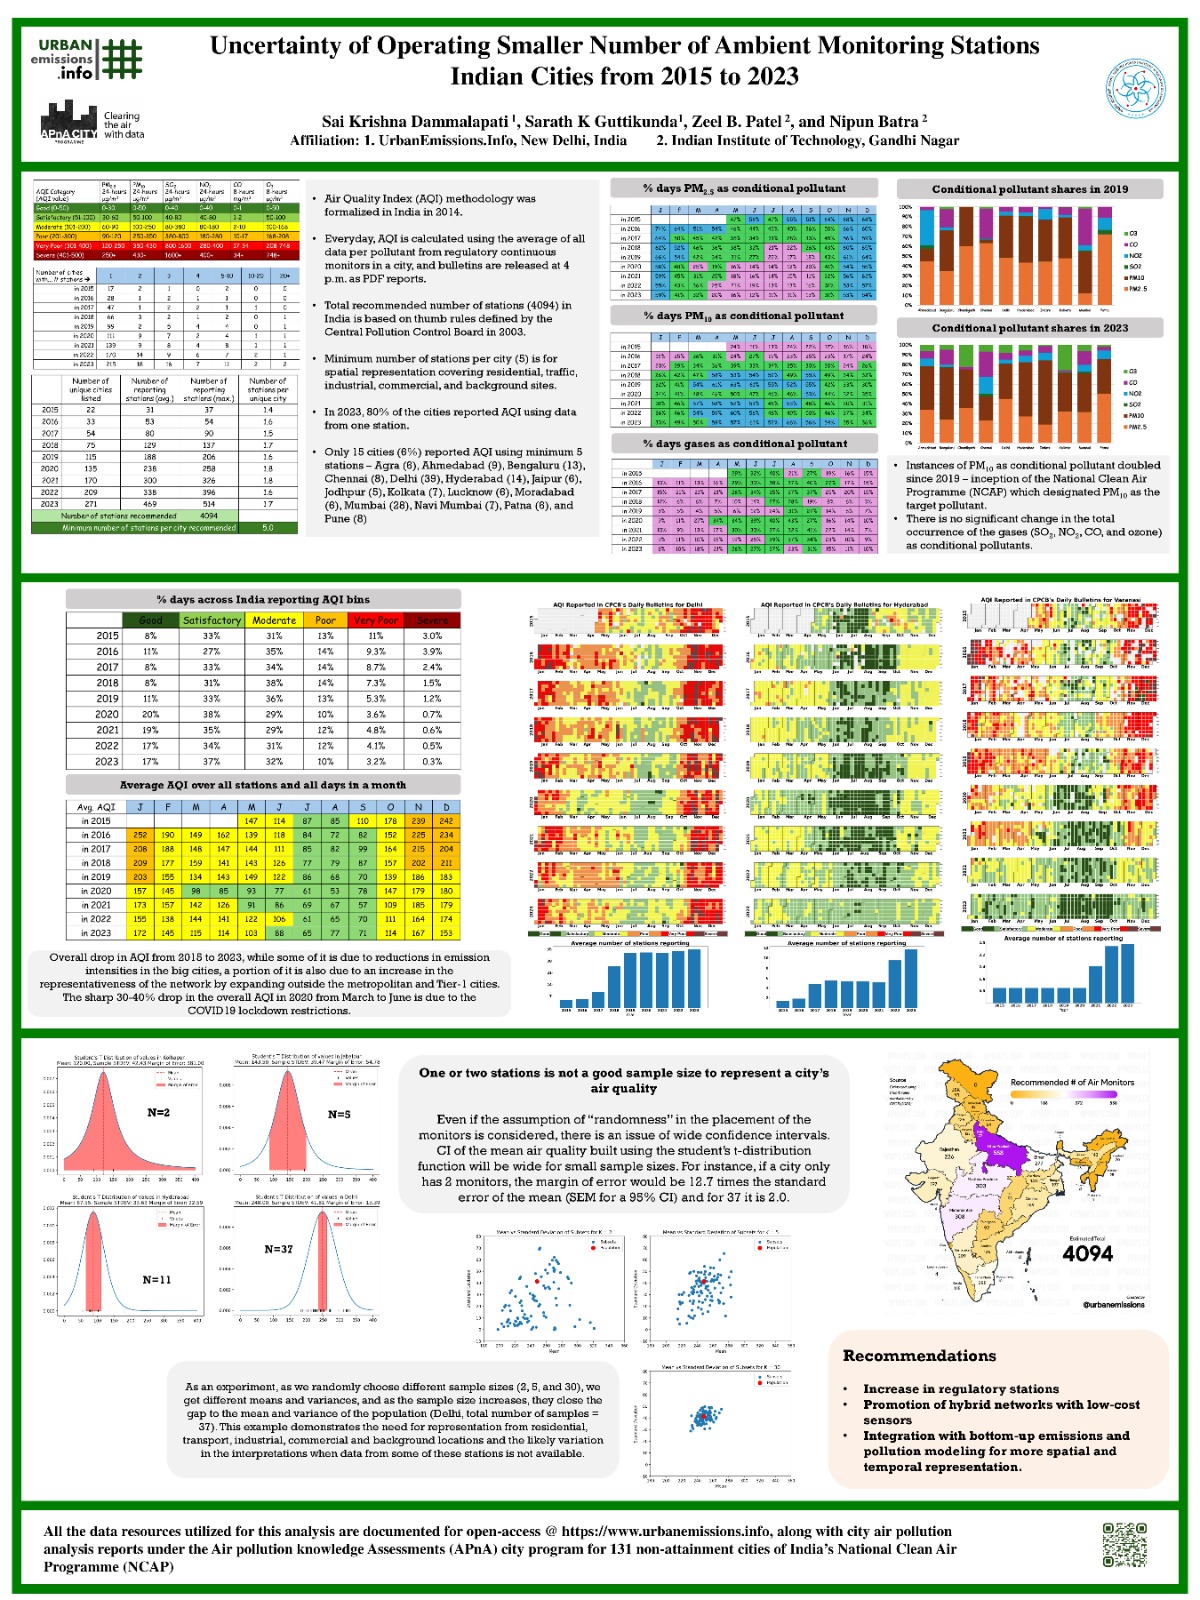
This research project is presented at the iCACGP-IGAC Conference 2024, Kuala Lumpur. Abstract
Detailed report can be accessed here: AQI Analysis for Indian cities from 2015-2023
This repository contains analysis of AQI Daily bulletins released by the Central Pollution Control Board (CPCB) since 2015. These daily bulletins can be currently obtained here: CPCB Daily AQI Bulletins
The data contains (available) day-wise city-average AQI value, AQI category, and conditional pollutant information. This data for all cities can be obtained in the AllIndiaBulletins_master.csv from data/Processed folder.
City wise AQI bulletins CSV and calendar plots can be obtained on UrbanEmissions website: Link
-
pdfparser.py: Extracted tables from all AQI bulletins from 2015. -
clean.py: Cleans all CSVs extracted and createsAllIndiaBulletins_Master.csv. Then manually cleanedCitycolumn for duplicates. (Chihuahua problem) -
cal_heatmaps.py: Creates calendar heatmaps for each city. -
aqi_research.py: Creates CSVs and plots that answers a few research questions as follows:- total unique cities by year
- total unique cities by month
- total number of monitoring stations by year
- total number of monitoring stations by month
- Average number of monitoring stations per city by year
- Average number of monitoring stations per city by months
-
Dr. Nipun Bhatra produced the plots that capture the uncertainty in AQI values with smaller number of stations. Link to the code. More explanation of this uncertainty can be found here: Document
-
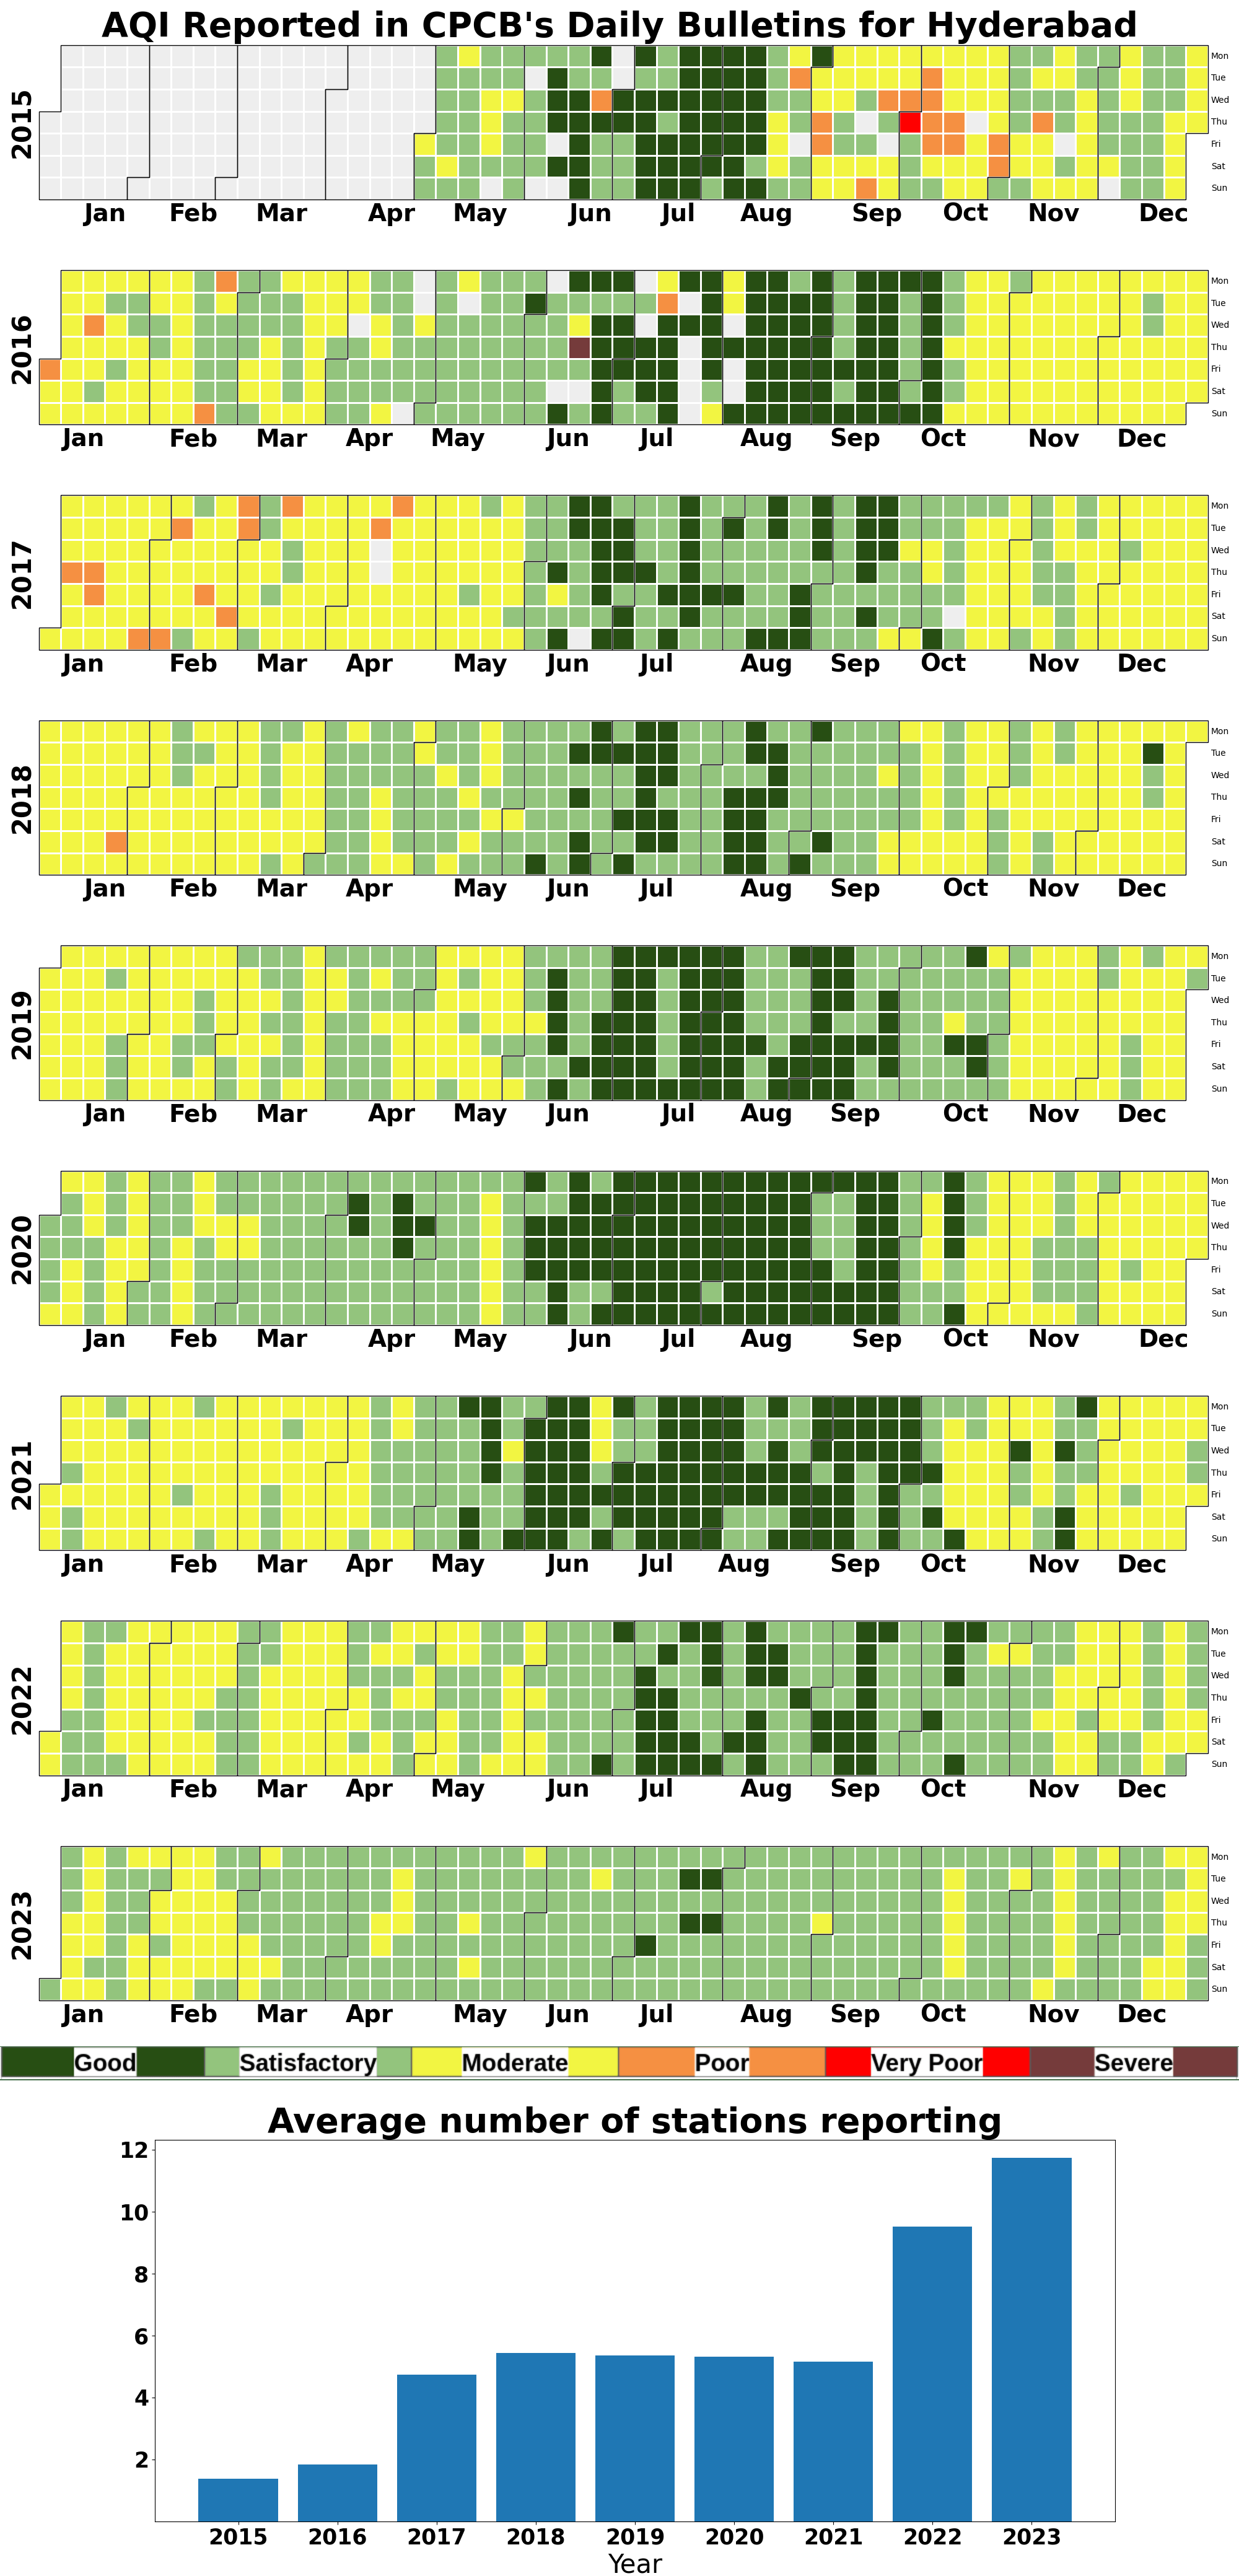
Calendar plot of the AQI values is produced for each city, along with the average number of stations reporting AQI value in each year. The following is a sample calendar plot for the city of Hyderabad.
To produce such calendar heat maps, refer to our Climate Visuals repository: Calendar Heatmap

