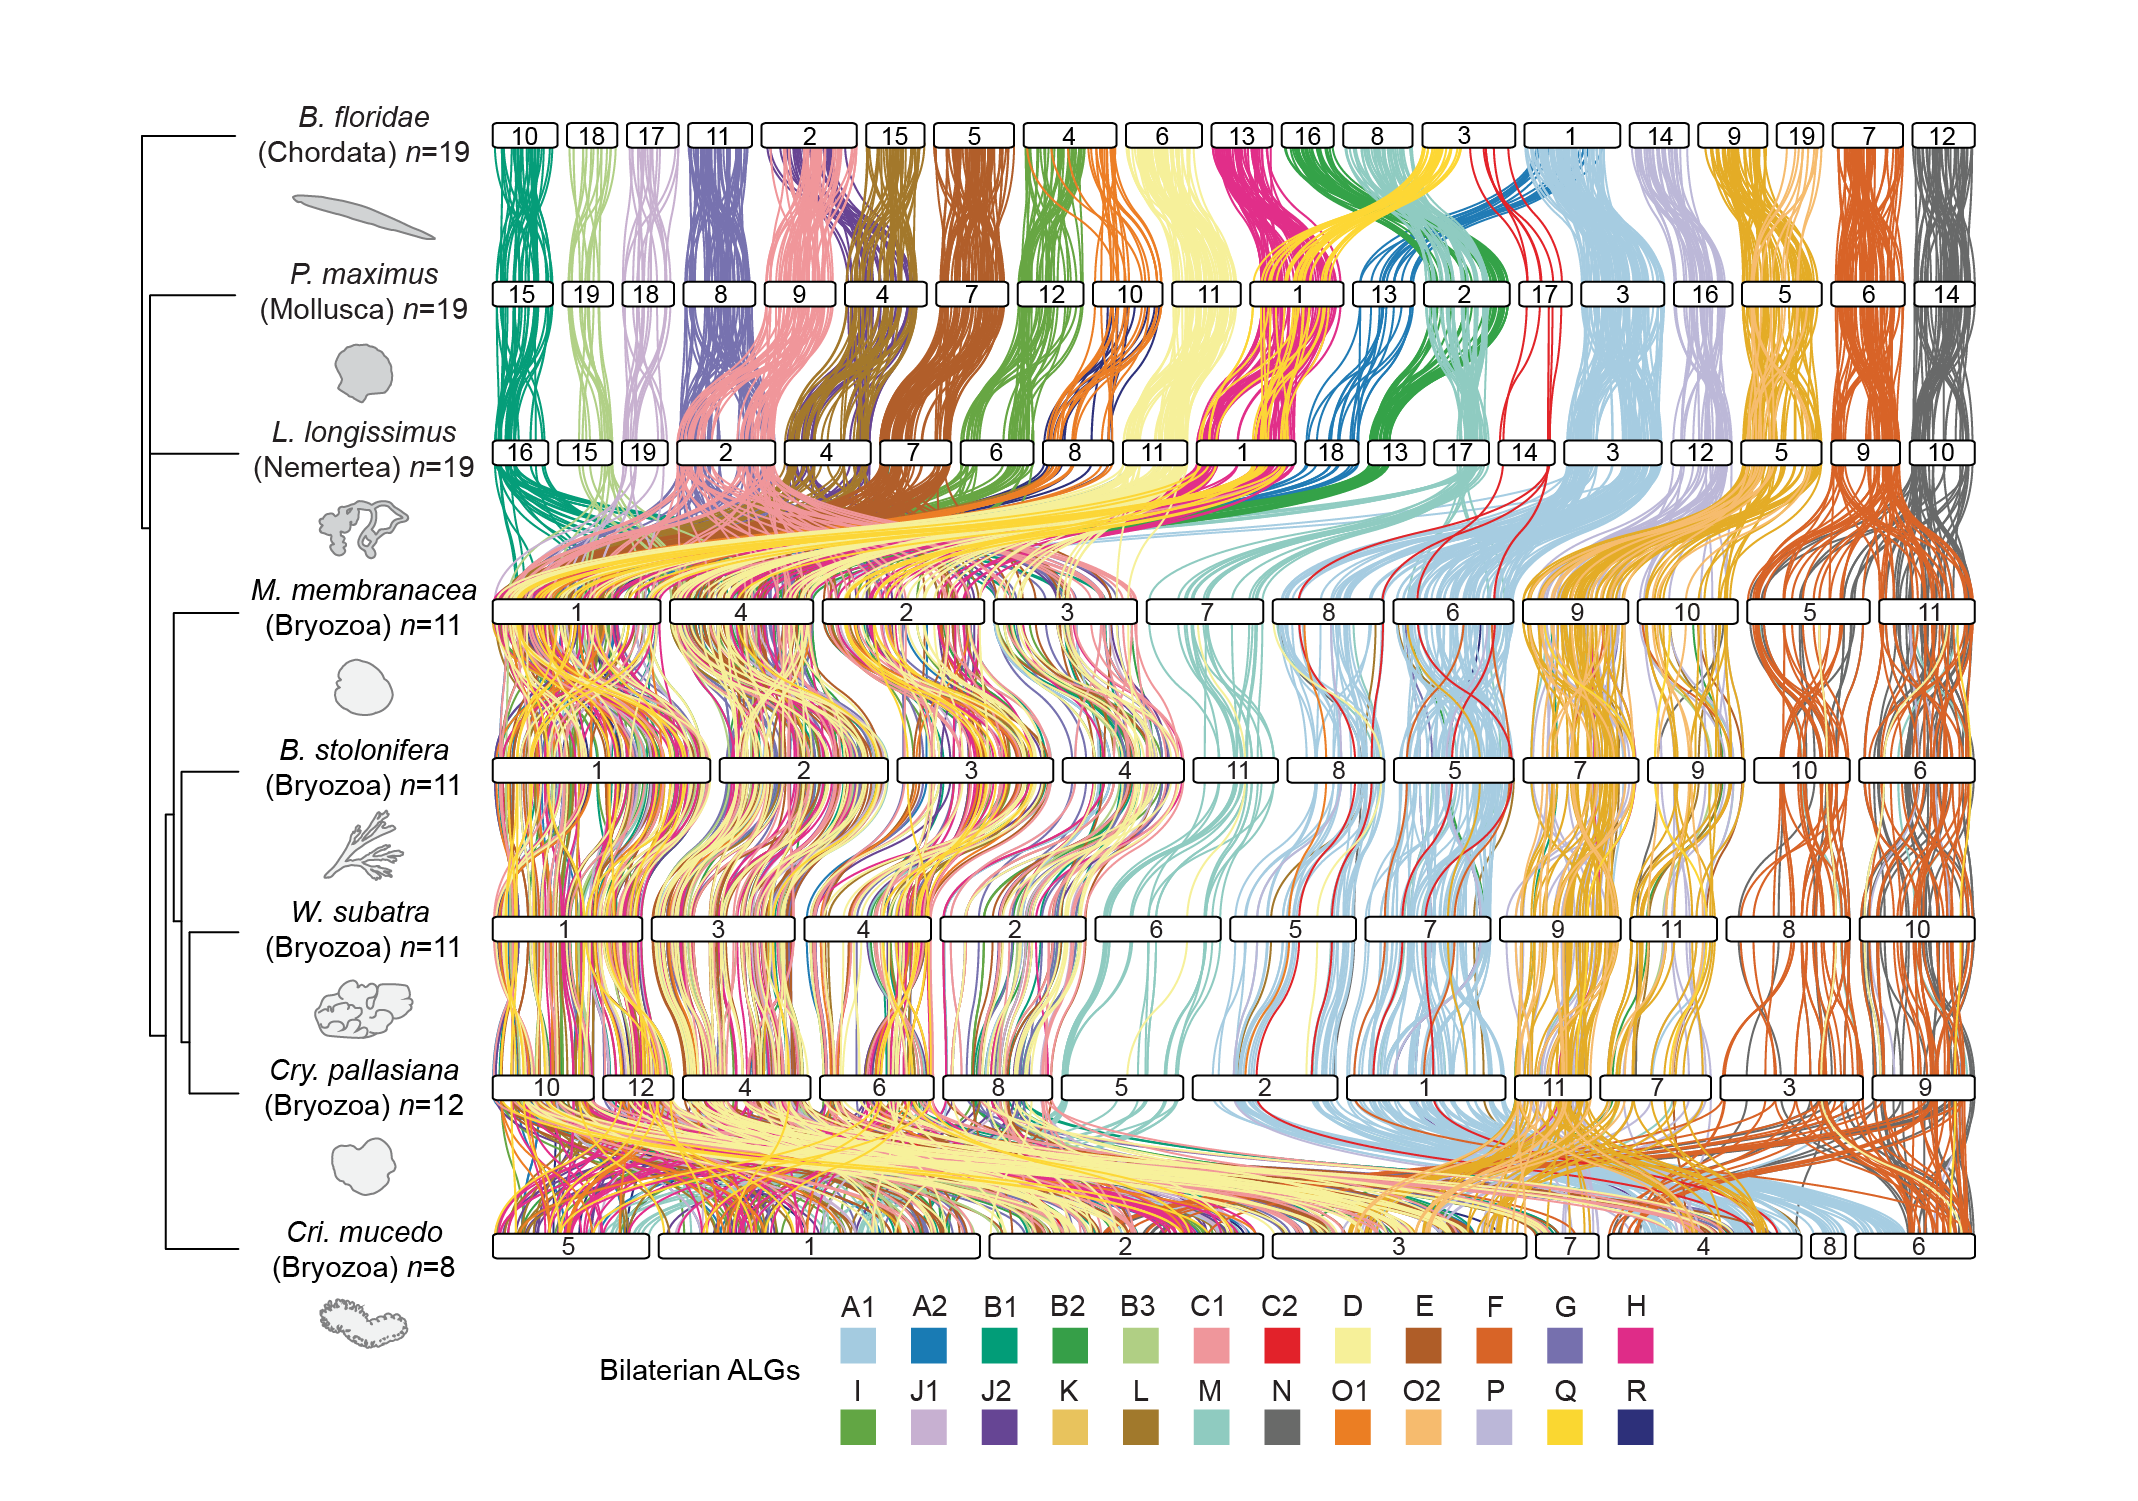
This repository contains a series of scripts which can be used to perform and visualise macrosynteny analysis on chromosome level genomes of metazoan species.
SyntenyFinder.py is a python script which takes NCBI genome assembly accessions and provides the karyotype and coordinate files necessary to run synteny analysis using Rideogram.
plot_ideogram.R takes the generated files and creates macrosynteny plots.
The following tree of files is provided in this repository:
SyntenyFinder
├── Bryozoan_Synteny
│   ├── Synteny_main.ipynb
│   ├── dependencies
│   │   └── Synteny_functions.ipynb
│   ├── input_data
│   │   ├── gene_rows
│   │   │   └── ...
│   │   ├── genomes
│   │   │   └── ...
│   │   └── proteomes
│   │       └── ...
│   └── synteny_v5.5.R
├── SyntenyFinder.py
├── dependencies
│   ├── Bfl
│   │   ├── Bfl.fna
│   │   ├── Bfl_ALGs.fasta
│   │   └── Bfl_gene_rows.gtf
│   └── Synteny_functions.py
└── plot_ideogram
    └── plot_ideogram.R
SyntenyFinder.pyis a python script which downloads genome assemblies from NCBI, runs OrthoFinder, and generates the karyotype and coordinate files necessary for macrosynteny analysis.dependenciescontains the files needed to runSyntenyFinder.pySynteny_functions.pycontains the required helper functions.Bflcontains the genome data for the Branchiostoma floridae ALG dataset used for comparison by default.
plot_ideogramprovides the file tree necessary to visualise the macrosynteny using RIdeogram- The karyotype and coordinate output files from
SyntenyFindershould be copied into theinputfolder. plot_ideogriam.Rgenerates the plots and saves the resulting svg and pdf files inideograms/svgandideograms/pdfrespectively.
- The karyotype and coordinate output files from
Bryozoan_Syntenycontains the code and data used to generate the figures for our research article. We have included it to show our process, but this directory is independent from the rest of the repository. Feel free to omit this directory entirely.Synteny_main.ipynbgenerated karyotype and coordinate files in a more customisable manner, allowing for a wider variety of intake files.input_datacontains links to our Dryad repository to download our Bryozoan genome files.synteny_v5.5.Rgenerated Oxford dot plots and RIdeogram macrosynteny plots, and additionally analysed mixing rates.
SyntenyFinder.py relies on OrthoFinder to identify single-copy orthologous genes. Please first make sure OrthoFinder and all necessary dependencies are correctly installed.
Additionally, SyntenyFinder.py uses NCBI's command line tools datasets and dataformat to download the requested accessions and pull assembly information such as species and number of chromosomes. Please ensure these are installed and running correctly.
The majority of packages used by SyntenyFinder are part of the Python Standard Library; namely subprocess, os, re, zipfile, argparse, concurrent.futures, and io. These should be available by default.
Additionally, Pandas and Biopython are required. These can be installed with the following commands:
pip install pandas
pip install biopython
Use the following command:
python /path/to/SyntenyFinder.py --help
To generate karyotype and coordinate files, run the following command in /SyntenyFinder:
python SyntenyFinder.py --accessions GCA_914767715.1,GCF_902652985.1 --run_name get_synteny
This command downloads the GenBank annotated genome assembly GCA_914767715.1 for the Bryozoan species Membranipora membranacea and the RefSeq annotated genome assembly GCF_902652985.1 for the scallop Pecten maximus. It runs OrthoFinder and finds single-copy orthologues, then generates karyotype and coordinate files. The folder get_synteny is created within the working directory /SyntenyFinder to store output, as well as intermediate run files.
python /path/to/SyntenyFinder.py \
--accessions accession1,accession2,accession3 \
--run_name run_name1 \
--algs Bfl \
--orthofinder path/to/orthofinder \
--threads 20 \
--directory path/to/root/folder
-
Required:
-
--accessions: Comma separated list of accessions for annotated chromosome level genomes on NCBI. -
--run_name: Name of run iteration used to create a directory
-
-
Optional:
-
--algs: Code or accession of species used in run to trace ancestral linkage groups. Where a non-Bfl species is used, the script traces genes according to their chromosome in the requested species. (Default:Bfl) -
--directory: Root directory for analysis folder to be created. (Default:./) -
--orthofinder: Path to executable OrthoFinder, if not installed -
--threads: Number of threads to use when running OrthoFinder
-
Running SyntenyFinder.py results in the generation of the following tree of files:
directory (root directory provided)
├── ncbi_downloads
│   ├── <Sp1>
│   │   └── ncbi_dataset
│   │       └── data
│   │           └── accession1
│   ├── <Sp2>
│   │   └── ncbi_dataset
│   │       └── data
│   │           └── accession2
│   └── ...
└── run_name
    ├── output
    │   ├── Bfl_coordinates.tsv
    │   ├── Bfl_karyotype.txt
    │   ├── Sp1_coordinates.tsv
    │   ├── Sp1_karyotype.txt
    │   ├── Sp2_coordinates.tsv
    │   ├── Sp2_karyotype.txt
    │   └── ...
    └── run_files
        ├── orthofinder_output
        │   └── Results_MmmDD
        │       ├── ...
        │       ├── Orthogroups
        │       └── ...
        └── run_proteomes
The files XXX_coordinates.tsv and XXX_karyotype.txt are the intake files necessary for running RIdeogram to generate a macrosynteny figure. Copy them to plot_ideogram/input and generate the plots using plot_ideogram.R.
- An ncbi_downloads folder is created in the provided root
directory, rather than in therun_namefolder. This improves efficiency, as it prevents the same accession from being downloaded multiple times across different run folders. - Species codes are defined by the first letter of an organism's genus name followed by the first two letters of its species name. In runs where multiple species share the same code, codes are defined by the first two letters of an organism's genus name followed by the first three letters of its species name. Unexpected issues may arise if multiple species share the same species code within the same directory provided.
The script SyntenyFinder/plot_ideogram/plot_ideogram.R takes the karyotype and coordinate files generated by SyntenyFinder and plots them using RIdeogram.
To use this script, first copy the output files from root_directory/run_name/output to plot_ideogram/input. Then create the directories indicated with an (*) as shown below for the output files of plot_ideogram.R.
SyntenyFinder
└── plot_ideogram
    ├── ideograms (*)
    │   ├── pdf (*)
    │   └── svg (*)
    ├── input (*)
    │   └── <copy output from SyntenyFinder>
    └── plot_ideogram.R
This script generates SVG and PDF files which can then be modified in illustrator to create the final figures.
Please cite our preprint if you use this pipeline:
