implement metrics in Spring Boot and export to Prometheus and Grafana?
or use exist one
compile('org.springframework.boot:spring-boot-starter-actuator')
runtime("io.micrometer:micrometer-registry-prometheus")management.endpoints.web.exposure.include=health,info,metrics,prometheus
Inject MeterRegistry, create and manage your application set of meters. Example:
    @Autowired
    fun setCounter(meterRegistry: MeterRegistry) {
        //counters -> increment value
        messageCounter = meterRegistry.counter("service.message.counter")
        operationCounter = meterRegistry.counter("service.message.long.operation.counter")

        //gauges -> shows the current value of a meter.
        lastMessageLength = meterRegistry.gauge("service.message.last.message.length", AtomicInteger())!!
        //shows collection size (queue message, cache size etc...). In real app the collection implementation used should be thread safe.
        messages = meterRegistry.gaugeCollectionSize("service.message.message.size", emptyList(), mutableListOf())!!

        //timer -> measures the time taken for short tasks and the count of these tasks.
        timer = meterRegistry.timer("service.message.long.operation.run.timer")

        //other meters...
}For example:
./gradlew bootRuncurl http://localhost:8080/actuator/metrics
{"names":["jvm.buffer.memory.used","jvm.memory.used","jvm.gc.memory.allocated","jvm.memory.committed","tomcat.sessions.created","tomcat.sessions.expired","tomcat.global.request.max","tomcat.global.error","jvm.gc.max.data.size","service.hello.operation.run.timer","service.message.operation.counter","logback.events","system.cpu.count","jvm.memory.max","jvm.buffer.total.capacity","jvm.buffer.count","process.files.max","jvm.threads.daemon","process.start.time","service.message.counter","tomcat.global.sent","tomcat.sessions.active.max","tomcat.threads.config.max","service.message.last.length","jvm.gc.live.data.size","process.files.open","process.cpu.usage","service.message.message.size","tomcat.servlet.request","process.uptime","tomcat.global.received","system.load.average.1m","tomcat.cache.hit","http.server.requests","jvm.gc.pause","tomcat.servlet.error","tomcat.servlet.request.max","tomcat.cache.access","tomcat.threads.busy","tomcat.sessions.active.current","system.cpu.usage","jvm.threads.live","jvm.classes.loaded","jvm.classes.unloaded","jvm.threads.peak","tomcat.threads.current","tomcat.global.request","jvm.gc.memory.promoted","tomcat.sessions.rejected","tomcat.sessions.alive.max"]}% curl http://localhost:8080/actuator/prometheus
# HELP jvm_gc_memory_promoted_bytes_total Count of positive increases in the size of the old generation memory pool before GC to after GC
# TYPE jvm_gc_memory_promoted_bytes_total counter
jvm_gc_memory_promoted_bytes_total 24576.0
...curl -s http://localhost:8080/actuator/prometheus |grep service_message
# HELP service_message_last_message_length
# TYPE service_message_last_message_length gauge
service_message_last_message_length 18.0
# HELP service_message_message_size
# TYPE service_message_message_size gauge
service_message_message_size 4.0
# HELP service_message_long_operation_run_timer_seconds
# TYPE service_message_long_operation_run_timer_seconds summary
service_message_long_operation_run_timer_seconds_count 74.0
service_message_long_operation_run_timer_seconds_sum 265.597506794
service_message_long_operation_run_timer_seconds_max 6.9341843
... - job_name: 'spring-boot-example-metric'
# Override the global default and scrape targets from this job every 5 seconds.
scrape_interval: 5s
metrics_path: '/actuator/prometheus' # path to spring boot metrics
static_configs:
- targets: ['spring-boot-example-metric:8080'] # host and port
and check Spring Boot endpoint status (menu: Status/Targets)
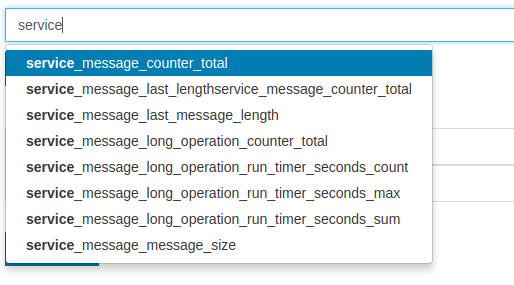
(menu: Graph)
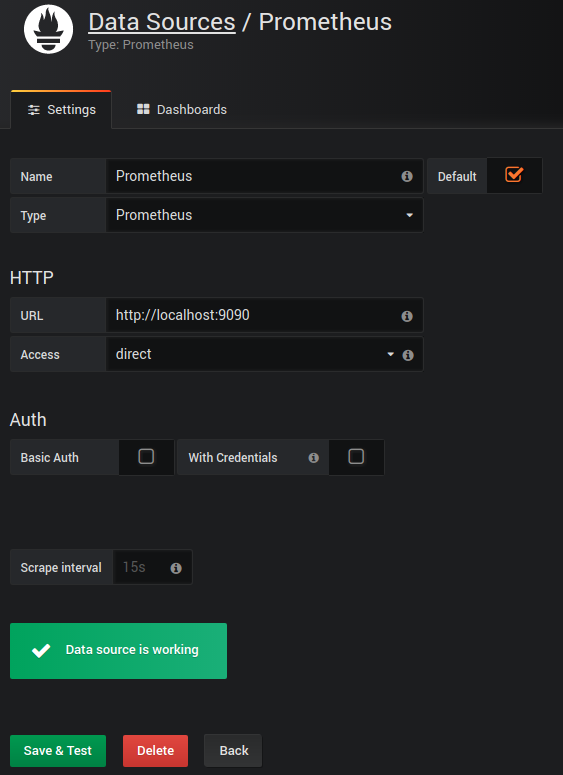
and add Prometheus data source
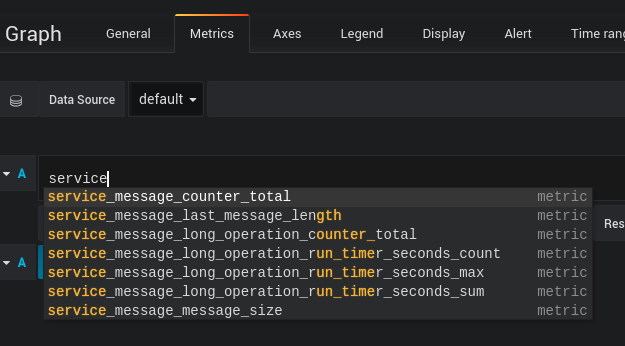
or use already created. For example: JVM (Micrometer) Dashboard
Docker and docker-compose
- kotlin
- gradle
- spring boot 2.0 (mvc, actuator)
- docker and docker-compose (I'm using Linux)
- prometheus
- grafana
git clone https://github.com/wojciech-zurek/kotlin-spring-boot-prometheus-grafana-example.git cd kotlin-spring-boot-prometheus-grafana-example/
./build.shdocker images
REPOSITORY TAG IMAGE ID CREATED SIZE
eu.wojciechzurek/spring-boot-example-metric 0.0.1 3499dee25307 About an hour ago 123MB
eu.wojciechzurek/spring-boot-example-metric latest 3499dee25307 About an hour ago 123MB
eu.wojciechzurek/custom-prometheus 0.0.1 17aaa34718de About an hour ago 112MB
eu.wojciechzurek/custom-prometheus latest 17aaa34718de About an hour ago 112MB
grafana/grafana latest 18cae91912fc 5 days ago 301MBcd kotlin-spring-boot-prometheus-grafana-example/
docker-compose updocker ps
CONTAINER ID IMAGE COMMAND CREATED STATUS PORTS NAMES
449f44b8a1d5 eu.wojciechzurek/custom-prometheus:latest "/bin/prometheus --c…" 41 minutes ago Up 41 minutes 0.0.0.0:9090->9090/tcp kotlinspringbootprometheusgrafanaexample_prometheus_1
348e2b0150be grafana/grafana "/run.sh" 41 minutes ago Up 41 minutes 0.0.0.0:3000->3000/tcp kotlinspringbootprometheusgrafanaexample_grafana_1
ab91021df26b eu.wojciechzurek/spring-boot-example-metric:latest "java -Djava.securit…" 41 minutes ago Up 41 minutes 0.0.0.0:8080->8080/tcp spring-boot-example-metric- example spring boot controller: http://localhost:8080/message
- Prometheus dashboard http://localhost:9000/
- Grafana dashboard (login: admin, password: admin) http://localhost:3000/
and add Prometheus type, direct access source (HTTP URL: http://localhost:9000/)
curl http://localhost:8080/message
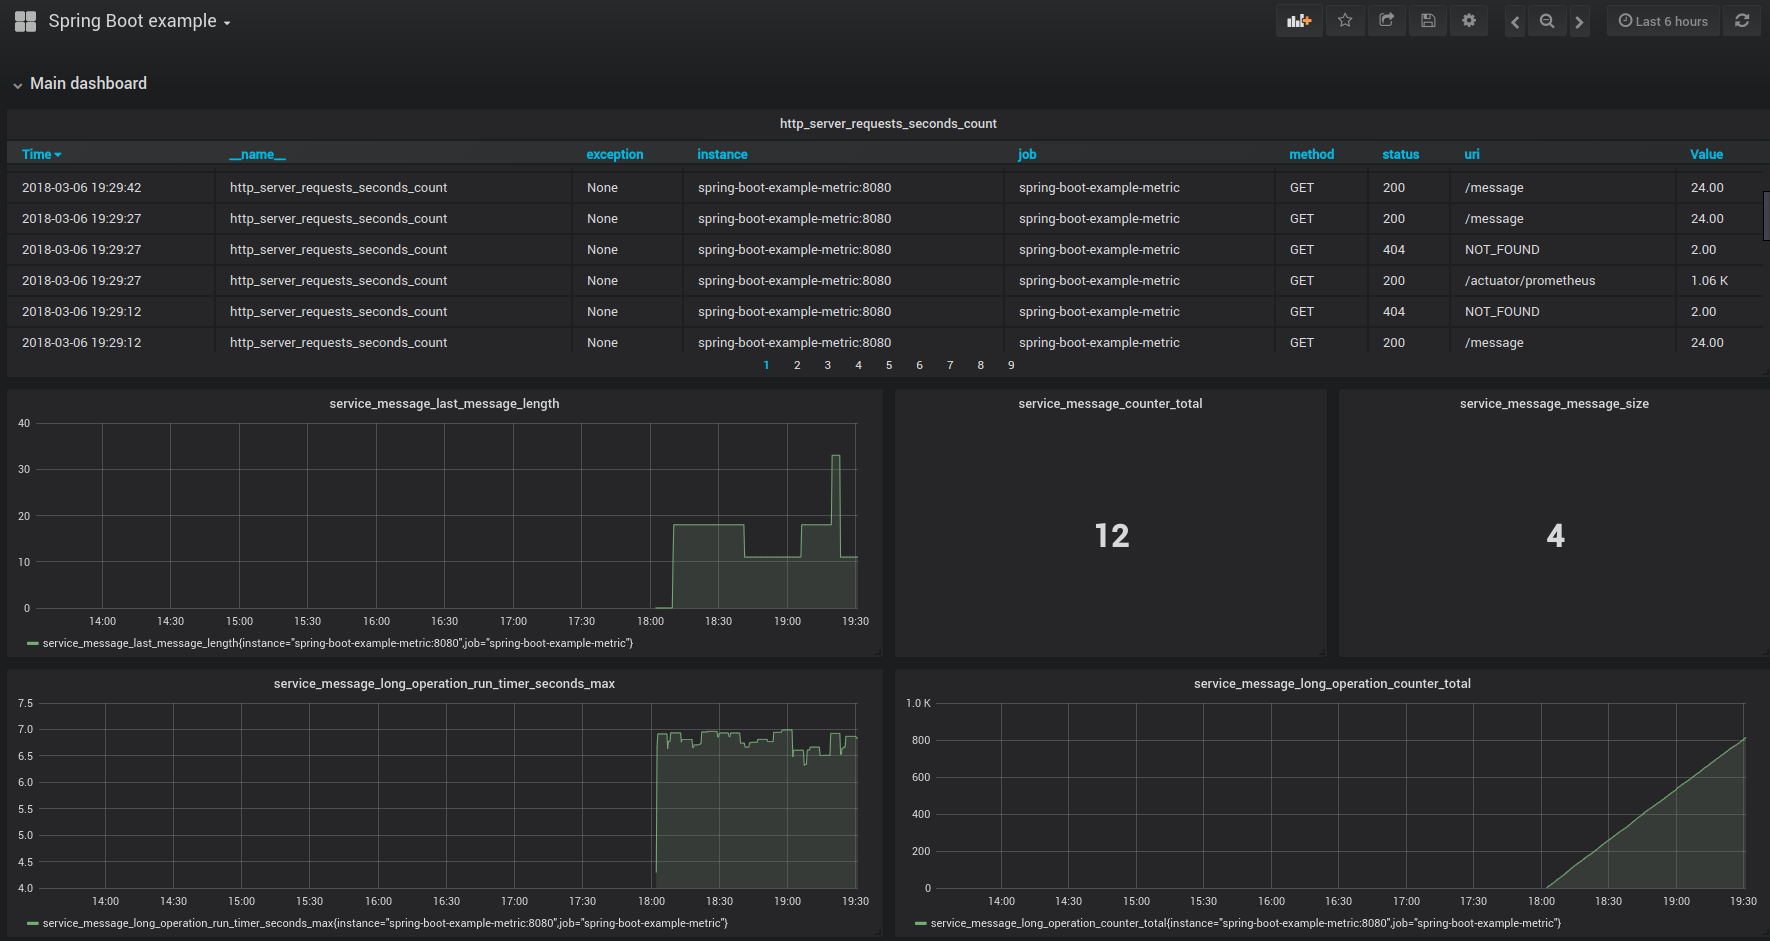
Hello Spring World% Go to: http://localhost:3000/dashboard/import and import grafana-spring-boot-example.json


