A FASTQ quality assessment tool
A. Thrash, M. Arick, and D. G. Peterson, “Quack: A quality assurance tool for high throughput sequence data,” Analytical Biochemistry, vol. 548, pp. 38–43, 2018. https://doi.org/10.1016/j.ab.2018.01.028
The latest release of quack and its binaries can always be found here.
- zlib
- klib (pulled by the submodule update below)
git clone https://github.com/IGBB/quack.git
cd quack/
make && make test
Binaries are available in the bin/ folder. Current testing of these binaries has been limited. If a binary doesn't work, try compiling from source on your system.
Quack has the following options.
  -1, --forward     forward strand data in gzipped FASTQ format, must be used with -2 or --reverse
  -2, --reverse     reverse strand data in gzipped FASTQ format, must be used with -1 or --forward
  -a, --adapters    adapters in gzipped FASTA format (optional)
  -n, --name    a descriptive name to be printed with the output image (optional)
  -u, --unpaired    unpaired data in gzipped FASTQ format
  -?, --help, --usage   prints the help or usage information
  -V, --version prints the program version
Quack takes gzipped FASTQ-formatted files as input for data and gzipped As output, quack prints an SVG formatted image to standard output.
quack -1 reads.1.fastq.gz -2 reads.2.fastq.gz -n sample_name -a adapters_files.fasta.gz > sample_name.svg
quack -u reads.fastq.gz -n sample_name -a adapters.fa.gz > sample_name.svg
quack -1 reads.1.fastq.gz -2 reads.2.fastq.gz > sample_name.svg
quack -u reads.fastq.gz > sample_name.svg
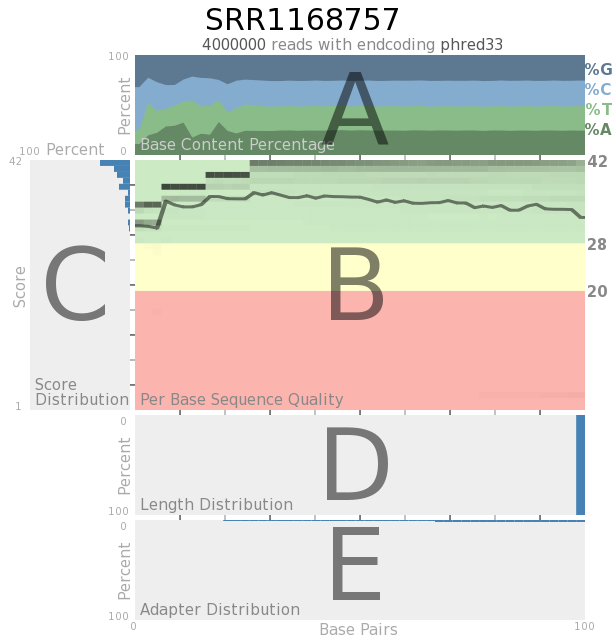
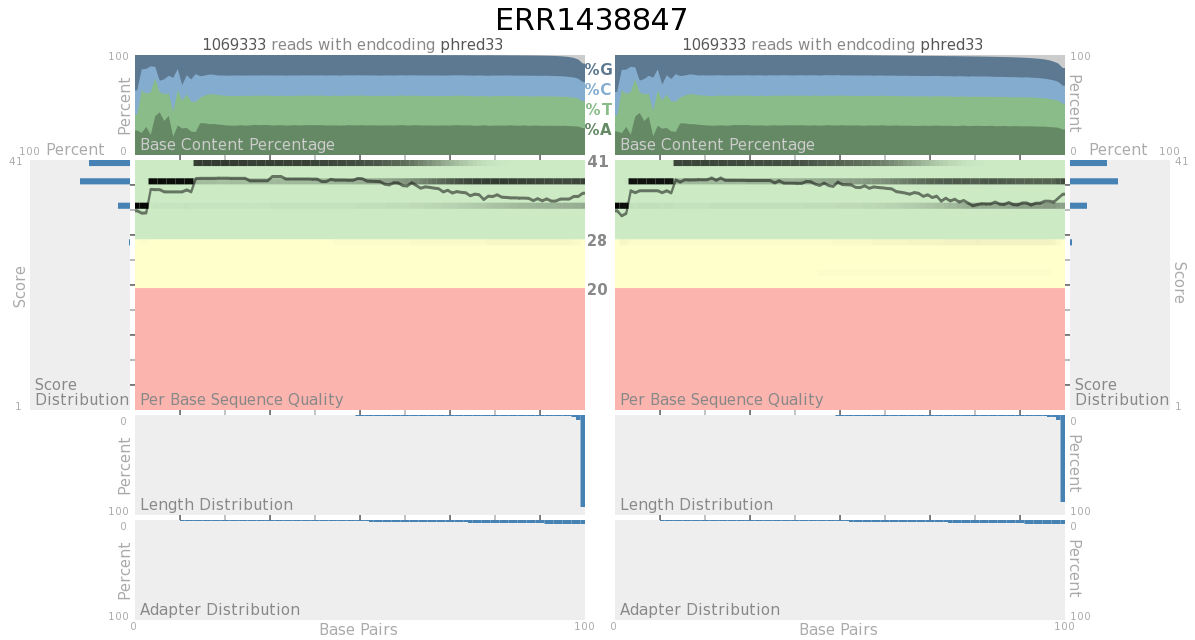
Quack is capable of producing output for single-ended data and paired-end data. Only the singled-ended data is labeled, since the paried-end data has all the same parts.
A. The base content distribution showing the percentage of each nucleotide in each column of an array.
B. A heatmap showing the distribution of sequence quality for each column and a line representing mean quality scores across the array
C. A score distribution graph showing the percentage of bases matching certain scores, with 100% on the left of the graph and 0% on the right. The highest scoring data appears at the top of the graph.
D. Length distribution graph showing the percentage of reads of a given length
E. Adapter content distribution graph showing how adapter content is distributed throughout an array

