SIAMCAT is a pipeline for Statistical Inference of Associations between
Microbial Communities And host phenoTypes. A primary goal of analyzing
microbiome data is to determine changes in community composition that are
associated with environmental factors. In particular, linking human microbiome
composition to host phenotypes such as diseases has become an area of intense
research. For this, robust statistical modeling and biomarker extraction
toolkits are crucially needed. SIAMCAT provides a full pipeline supporting
data preprocessing, statistical association testing, statistical modeling
(LASSO logistic regression) including tools for evaluation and interpretation
of these models (such as cross validation, parameter selection, ROC analysis
and diagnostic model plots).
SIAMCAT is developed in the
Zeller group
and is part of the suite of computational microbiome analysis tools hosted at
EMBL.
In order to start with SIAMCAT, you need to install it from Bioconductor:
if (!requireNamespace("BiocManager", quietly = TRUE))
    install.packages("BiocManager")
BiocManager::install("SIAMCAT")
Alternatively, you can install the current development version via devtools:
require("devtools")
devtools::install_github(repo = 'zellerlab/siamcat')There are a few manuals that will kick-start you and help you analyse your
data with SIAMCAT. You can find links to those on the
Bioconductor website of SIAMCAT
or you can type into R:
browseVignettes("SIAMCAT")
# Please Note:
# `browseVignettes` only works if `SIAMCAT` has been installed via BioconductorIf you have any question about SIAMCAT, if you run into any issue,
or if you would like to make a feature request, please:
- create an issue in this repository or
- mail Georg Zeller or
- ask at the SIAMCAT support group
If you have a more general question (that could be useful to several other users), please do not hesitate to post it on a dedicated forums such as Stackoverflow or Biostars. If you let us know about the question, we will answer it swiftly.
Please consider giving us feedback. (This feedback is useful for us to justify the funding we get for developing and maintaining this package.)
SIAMCAT is distributed under the GPL-3 license.
If you use SIAMCAT, please cite us by using
citation("SIAMCAT")or by
Wirbel J, Zych K, Essex M, Karcher N, Kartal E, Salazar G, Bork P, Sunagawa S, Zeller G Microbiome meta-analysis and cross-disease comparison enabled by the SIAMCAT machine learning toolbox Genome Biol 22, 93 (2021) https://doi.org/10.1186/s13059-021-02306-1
In this publication, we analyzed a large set of case-control microbiome
datasets. The metadata and taxonomic profiles of these studies are available
through a Zenodo repository:
.
To give you a small preview about the primary package output, here are some
example plots taking from the main SIAMCAT vignette.
In this vignette, we use an example dataset which is also included in
the SIAMCAT package. The dataset is taken from the publication of
Zeller et al, which demonstrated
the potential of microbial species in fecal samples to distinguish patients
with colorectal cancer (CRC) from healthy controls.
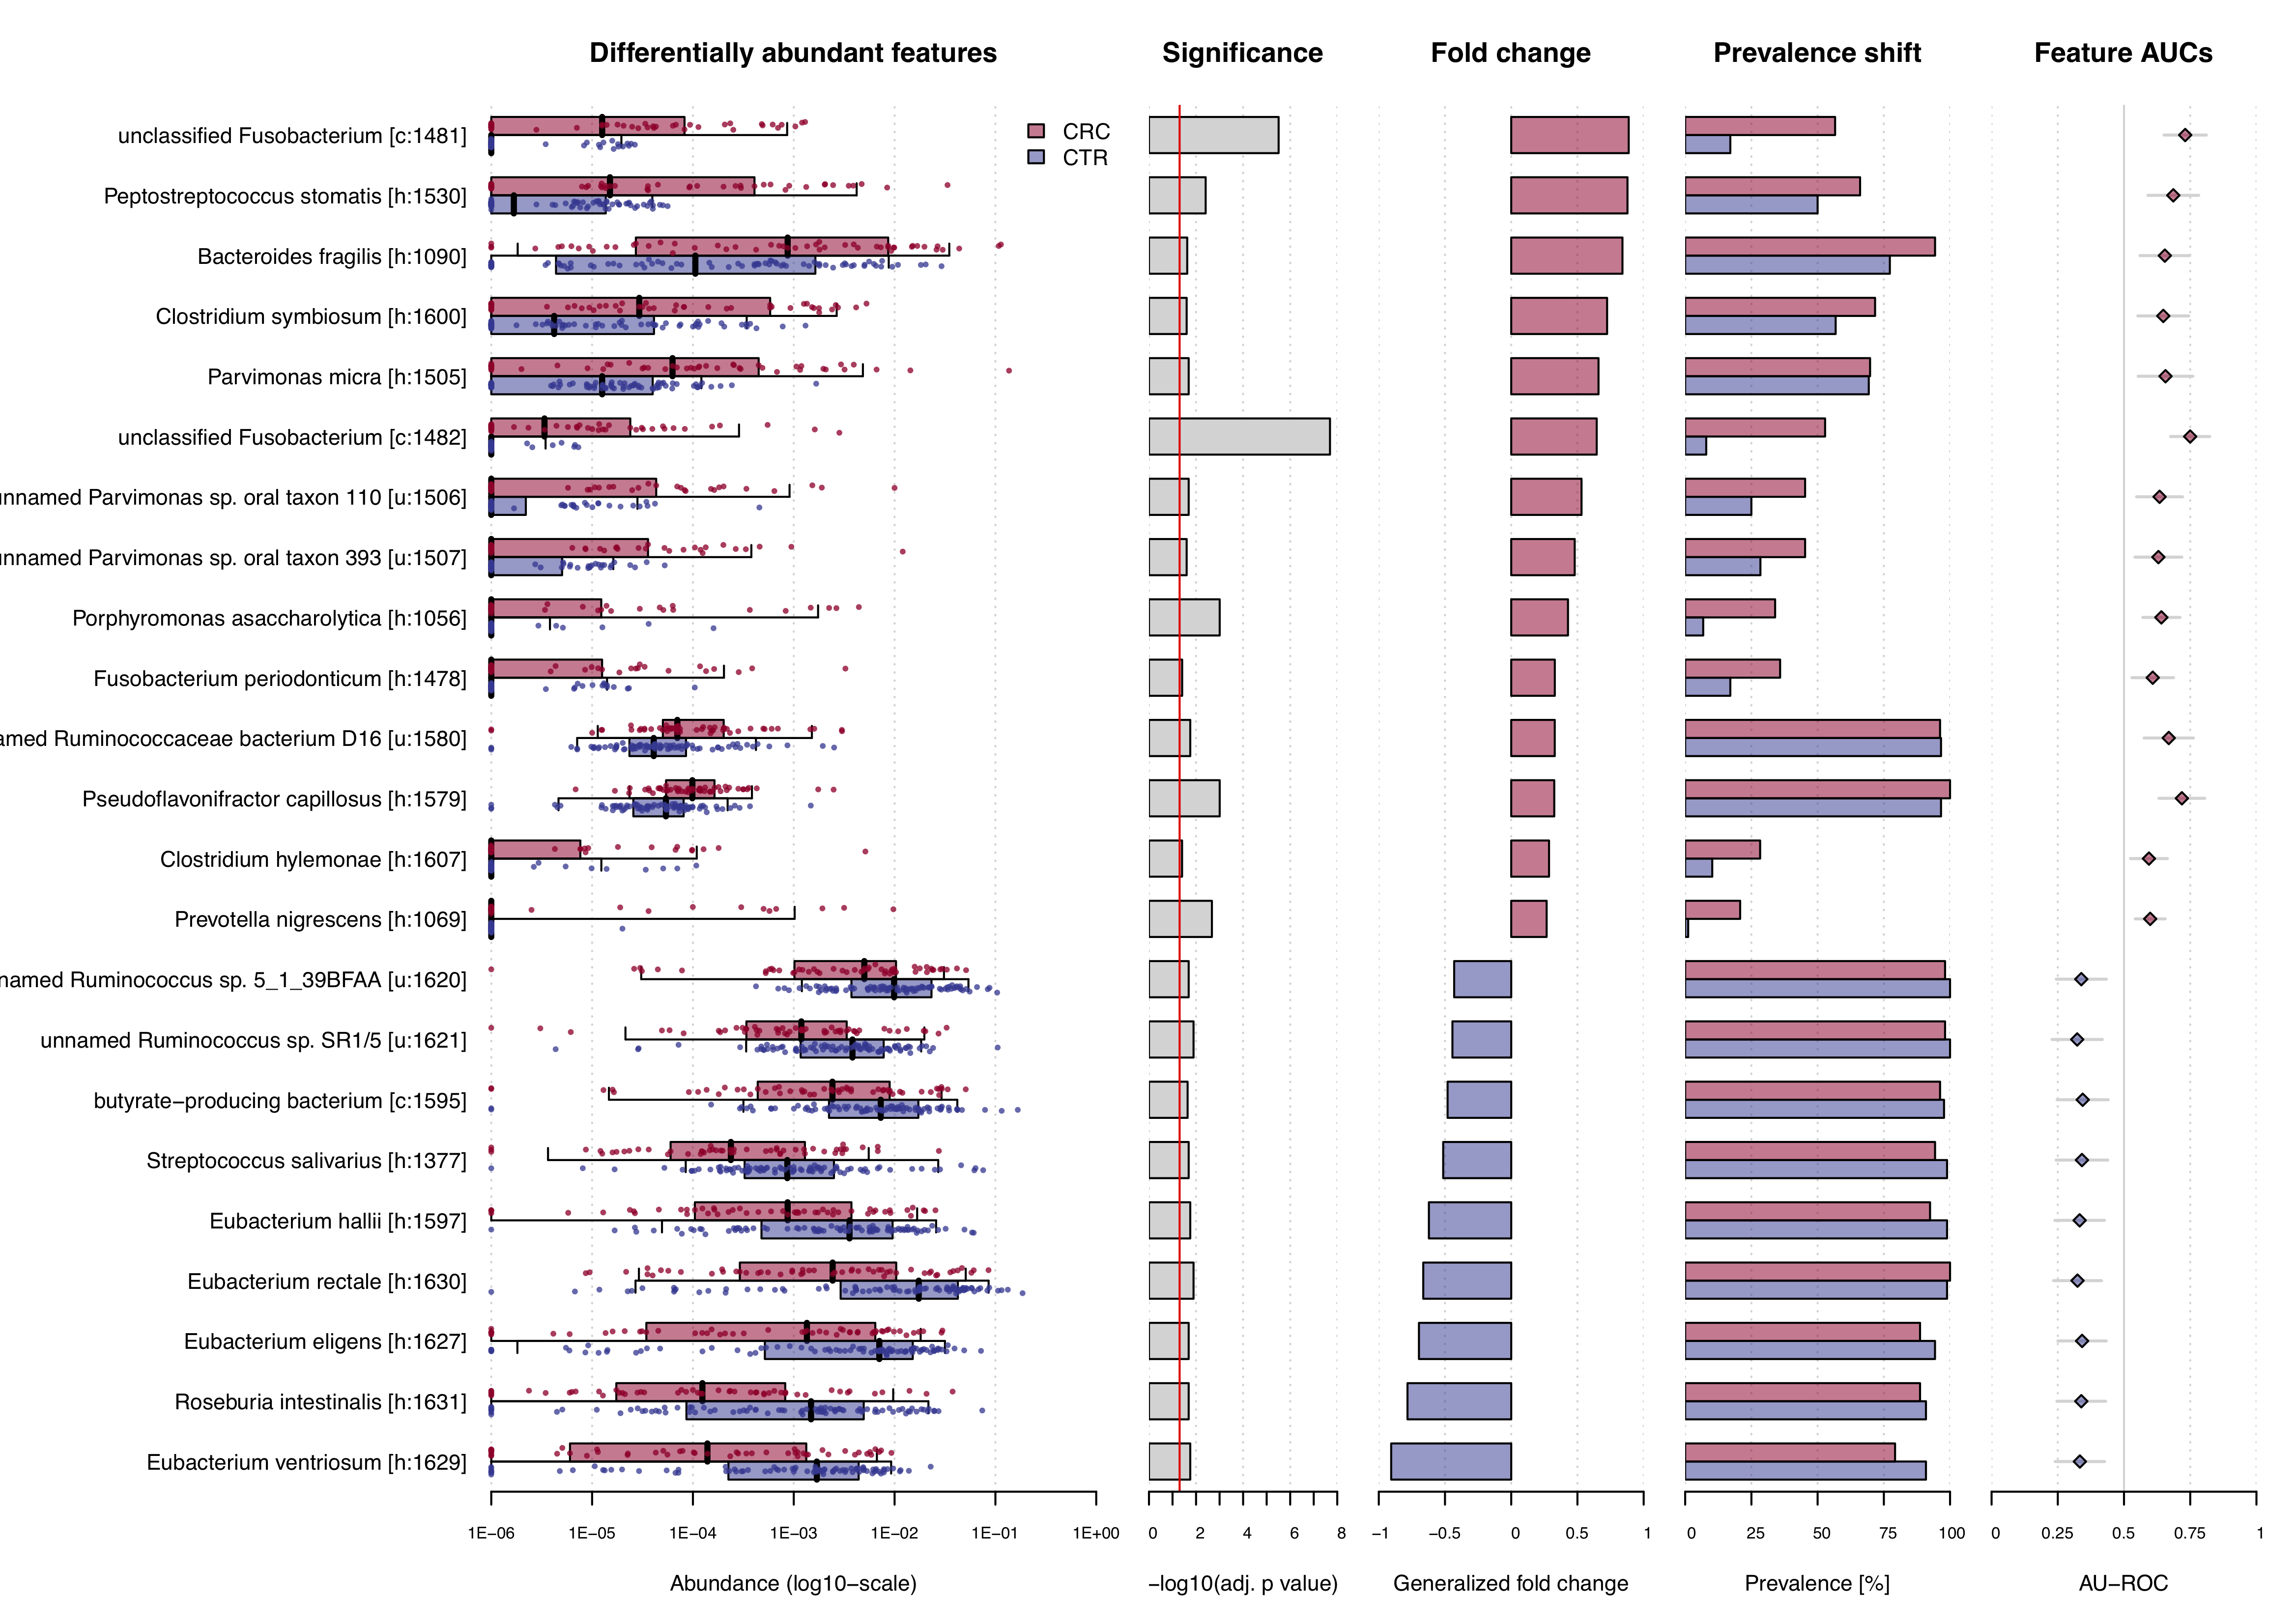
The result of the check.associations function is an association plot.
For significantly associated microbial features, the plot shows:
- the abundances of the features across the two different classes (CRC vs. controls)
- the significance of the enrichment calculated by a Wilcoxon test (after multiple hypothesis testing correction)
- the generalized fold change of each feature
- the prevalence shift between the two classes, and
- the Area Under the Receiver Operating Characteristics Curve (AU-ROC) as non-parametric effect size measure.
After statistical models have been trained to distinguish cancer cases
from controls, the models can be investigated by the function
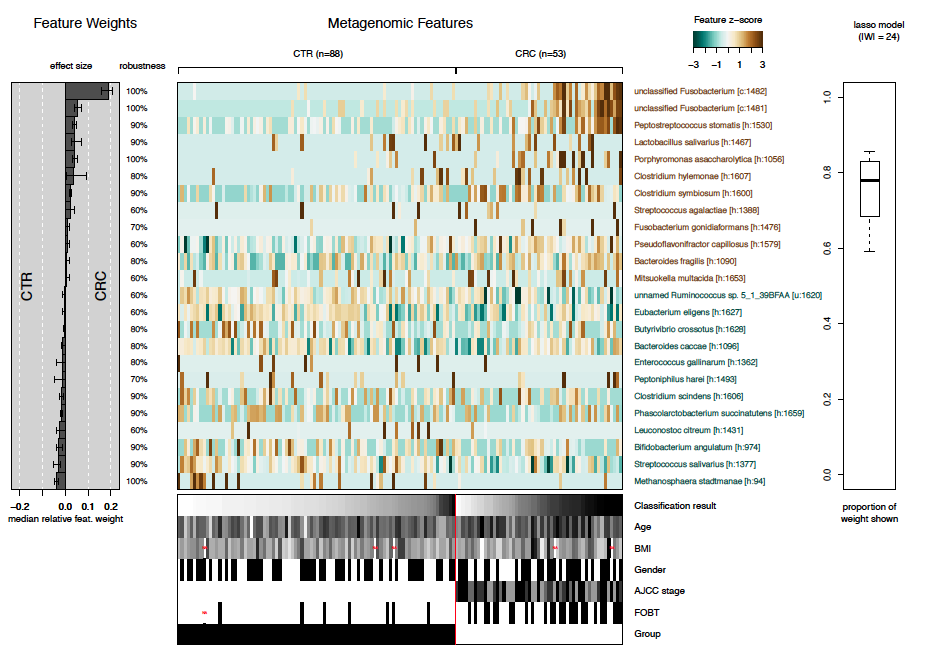
model.interpretation.plot. The plots shows:
- the median relative feature weight for selected features (barplot on the left)
- the robustness of features (i.e. in how many of the models the specific feature has been selected)
- the distribution of selected features across samples (central heatmap)
- which proportion of the weight of all different models are shown in the plot (boxplot on the right), and
- distribution of metadata across samples (heatmap below).
Several publications already used SIAMCAT (or previous versions thereof).
- Potential of fecal microbiota for early-stage detection of colorectal cancer
Zeller G, Tap J, Voigt AY, Sunagawa S, Kultima JR, Costea PI, Amiot A, Böhm J, Brunetti F, Habermann N, Hercog R, Koch M, Luciani A, Mende DR, Schneider MA, Schrotz-King P, Tournigand C, Tran Van Nhieu J, Yamada T, Zimmermann J, Benes V, Kloor M, Ulrich CM, von Knebel Doeberitz M, Sobhani I, Bork P
Molecular Systems Biology, (2014) 10, 766
Original Publication that inspired
SIAMCAT
- Gut Microbiota Linked to Sexual Preference and HIV Infection
Noguera-Julian M, Rocafort M, Guillén Y, Rivera J, Casadellà M, Nowak P, Hildebrand F, Zeller G, Parera M, Bellido R, Rodríguez C,Carrillo J, Mothe B, Coll J, Bravo I, Estany C, Herrero C, Saz J, Sirera G, Torrela A, Navarro J, Crespo M, Brander C, Negredo E, Blanco J, Guarner F, Calle ML, Bork P, Sönnerborgd A, Clotet B, Paredes R
EBioMedicine 5 (2016) 135-146
See Figure 5
- Extensive transmission of microbes along the gastrointestinal tract
Schmidt TSB, Hayward MR, Coelho LP, Li SS, Costea PI, Voigt AY, Wirbel J, Maistrenko OM, Alves RJC, Bergsten E, de Beaufort C, Sobhani I, Heintz-Buschart A, Sunagawa S, Zeller G, Wilmes P, Bork P
eLife, (2019) 8:e42693
See Figure 3 - figure supplement 1
- Meta-analysis of fecal metagenomes reveals global microbial signatures
that are specific for colorectal cancer
Wirbel J, Pyl PT, Kartal E, Zych K, Kashani A, Milanese A, Fleck JS, Voigt AY, Palleja A, Ponnudurai R, Sunagawa S, Coelho LP, Schrotz-King P, Vogtmann E, Habermann N, Niméus E, Thomas AM, Manghi P, Gandini S, Serrano D, Mizutani S, Shiroma H, Shiba S, Shibata T, Yachida S, Yamada T, Waldron L, Naccarati A, Segata N, Sinha R, Ulrich CM, Brenner H, Arumugam M, Bork P, Zeller G
Nature Medicine, (2019) [Epub ahead of print]
In this publication,
SIAMCATis used extensively for holdout testing
If you used SIAMCAT in your publication,
let us know!


