Visualization for selfspy | Plots for selfstats
Examples
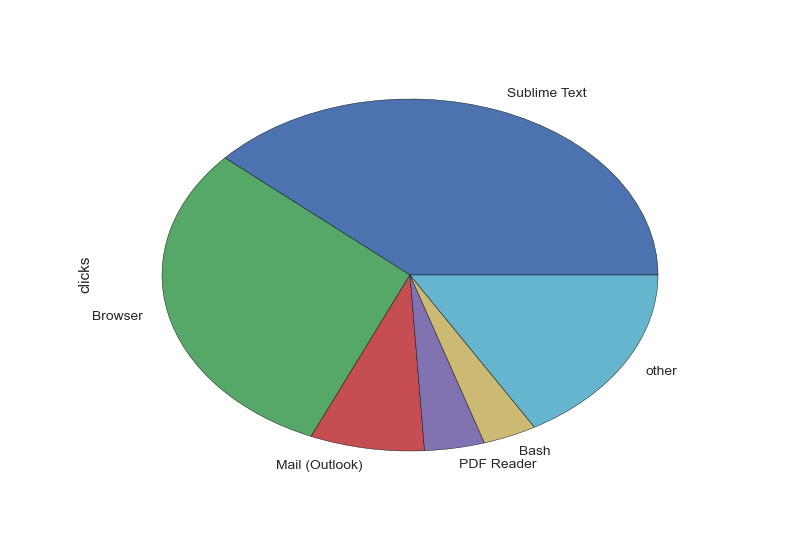
🐭 Clicks
Last hours (bar chart)
Total (pie chart)
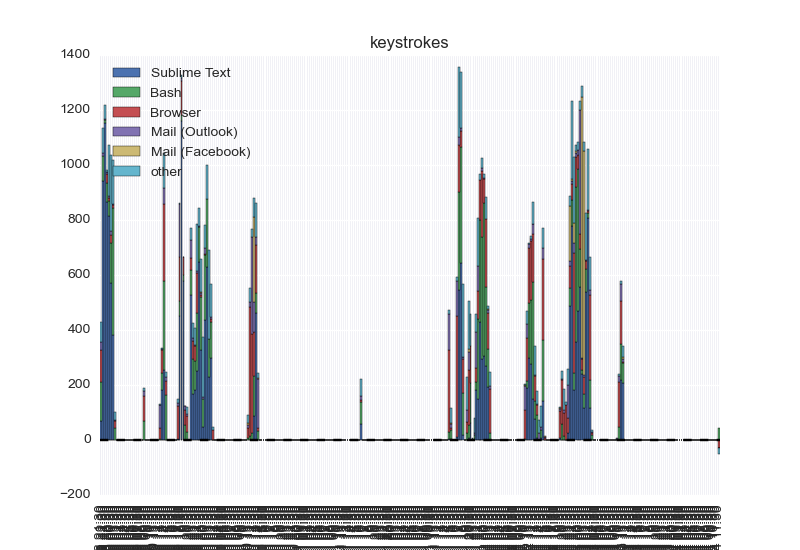
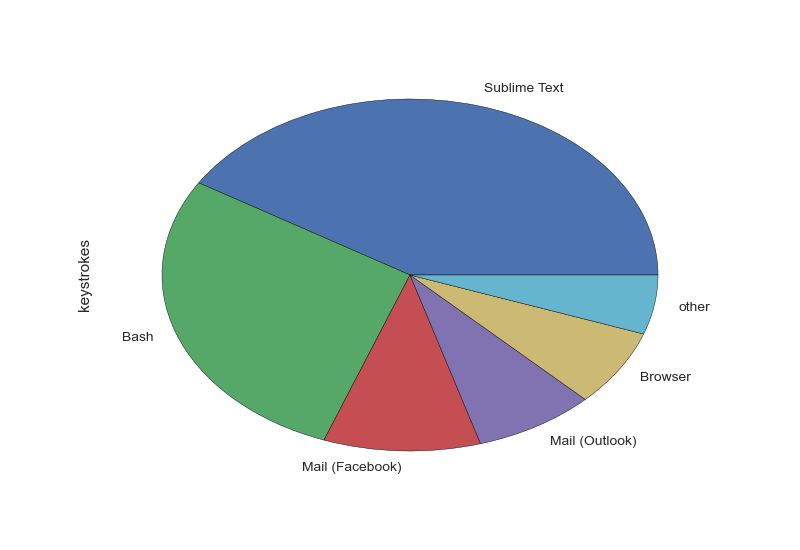
🎹 Keystrokes
Last hours (bar chart)
Total (pie chart)
Other visualizations
Not yet 🎅.
Command line
The graphs above have been generated by these commands.
You need to add selfvis.py in your PATH. And then run:
$ selfvis.py --human-readable --pactive --back 8 h
Or:
$ selfvis.py --human-readable --ratios --back 8 h
Installation
Install selfspy, then the requirements with pip :
$ pip install -r requirements.txt
You might need to give it sudo rights :
$ sudo pip install -r requirements.txt
Usage
The script is a modified version of the selfstats program.
The same options apply. Try e.g.
$ python selfvis.py
Code status
Currently implemented is a breakdown of hours (stacked bar chart) and a pie chart (all time totals). Both plots are saved for clicks and for keypresses, respectively.
It's very likely that long intervals aren't split correctly.
🔧 Options
Filtering options of original selfstats continue to work.
See here.
📝 Config
In ~/.selfspy/simplification_rules.txt, add rules of the form
regexp --> name
For examples:
^\s*::\s*$ --> unknown
^(.+)::\s*$ --> \1
^(.+)::.*$ --> \1
# ^(.+)::(\w+).*$ --> \1:\2
^Firefox::.*YouTube.*$ --> Browser (Youtube)
^Firefox::.*GitHub.*$ --> Browser (GitHub)
^Firefox::.*Google Search.*$ --> Browser (search)
# ^.*Skype.*$ --> Skype
# ^.*Zimbra.*$ --> Mail
# ^.*\bmutt\b.*$ --> Mail
# ^.*\bzsh\b.*$ --> shell
to keep descriptions in legends short and expressive. Last matching rule (LHS) wins.
See this example for the rules I like.
FAQ 🔍
Q: Is there a nice webpage to display the graphs?
A: Yes, use this HTML file, host it locally.
- Download it raw from here,
- Put it somewhere where your local web server can find it (
~/Public/,~/www/or whatever, depending on your system), - Generate the graphs in the same folder (you can do it on a daily basis, e.g. with a cron job,
- Access the page on your web-browser. Tadaa!
It uses StrapDown.js.
Q: Is it supposed to be that slow?
A: Yup, don't expect your graphs to be produced in two seconds, it can take up-to 15 seconds.
A: Note: You can use an option to shorten the time window used for the plot: for instance
selfvis.py --back 8 honly uses the data from the last 8h.
Q: Can I ...?
A: Yes, as long as you respect the terms of the GPLv3 License.
Other self-quantified projects ?
- uLogMe: keep track of your computer activity throughout the day: visualize your active window titles and the number and frequency of keystrokes, in beautiful and responsive HTML timelines.
- Munin, can also help to keep track of the uptime (and many more stats) of your (Linux) machine. See these plugins I wrote for my Munin.
- My minimalist dashboard, generated every hour (with a
crontabfile), with this bash scriptGenerateStatsMarkdown.sh.
💁 About
📝 Authors?
- Forked by: Lilian Besson (Naereen),
- Original author: Hannes Schulz (temporaer).
📜 License ? 
GPLv3 Licensed (file LICENSE). © Lilian Besson, 2016.


