CellMap Viewer is a Web application for 3D-visualization of a cell map (cell differentiation landscape). It reads cell data including coordinates and features from a CSV-formatted text file, computes Delaunay triangulations, and displays the result.
- Sample dataset is available here.
- Input data can be created by CellMap (landscape inference method).
Last updated: August 26th, 2022
Japanese- Overview
- User interface
- Input file format
- Visualizing your cell map data
- Reading a cell map
- Algorithm for visualization
- Configuring visualization
- Controlling the viewpoint
- Selecting cells
- Finding a path
- Taking a screenshot
CellMapViewer is a Web application for 3D-visualization of a cell map. It reads cell data including coordinates and features from a CSV-formatted text file, computes Delaunay triangulations, and displays the result.
Once displayed, you can:
- control the viewpoint with the mouse;
- select cells with the mouse;
- display contours, mesh, and streamlines;
- find the shortest path between two points, and draw chart for feature values on the path;
- save a screenshot in PNG format;
- save data of selected cells as a CSV-formatted text file;
- save and load the configure file; and
- load cell data automatically.
In addition, via the GUI menu, you can configure:
- triangles to remove from the triangulation;
- the z axis feature;
- the annotation feature;
- the streamlines feature;
- the coloring of the surface, the cells, the contours, the mesh and the background;
- the cell point size and the width of path, contours, and mesh;
- the visibility of the annotations, the surface, the cell points (display ratio), the contours, the mesh, the stremlines, and the grid; and
- whether to highlight the selected cells.
Furthermore, it automatically shows the information of the selected cells, including the coordinates and the features, as well as statistics such as mean.
English- and Japanese-versions are available.
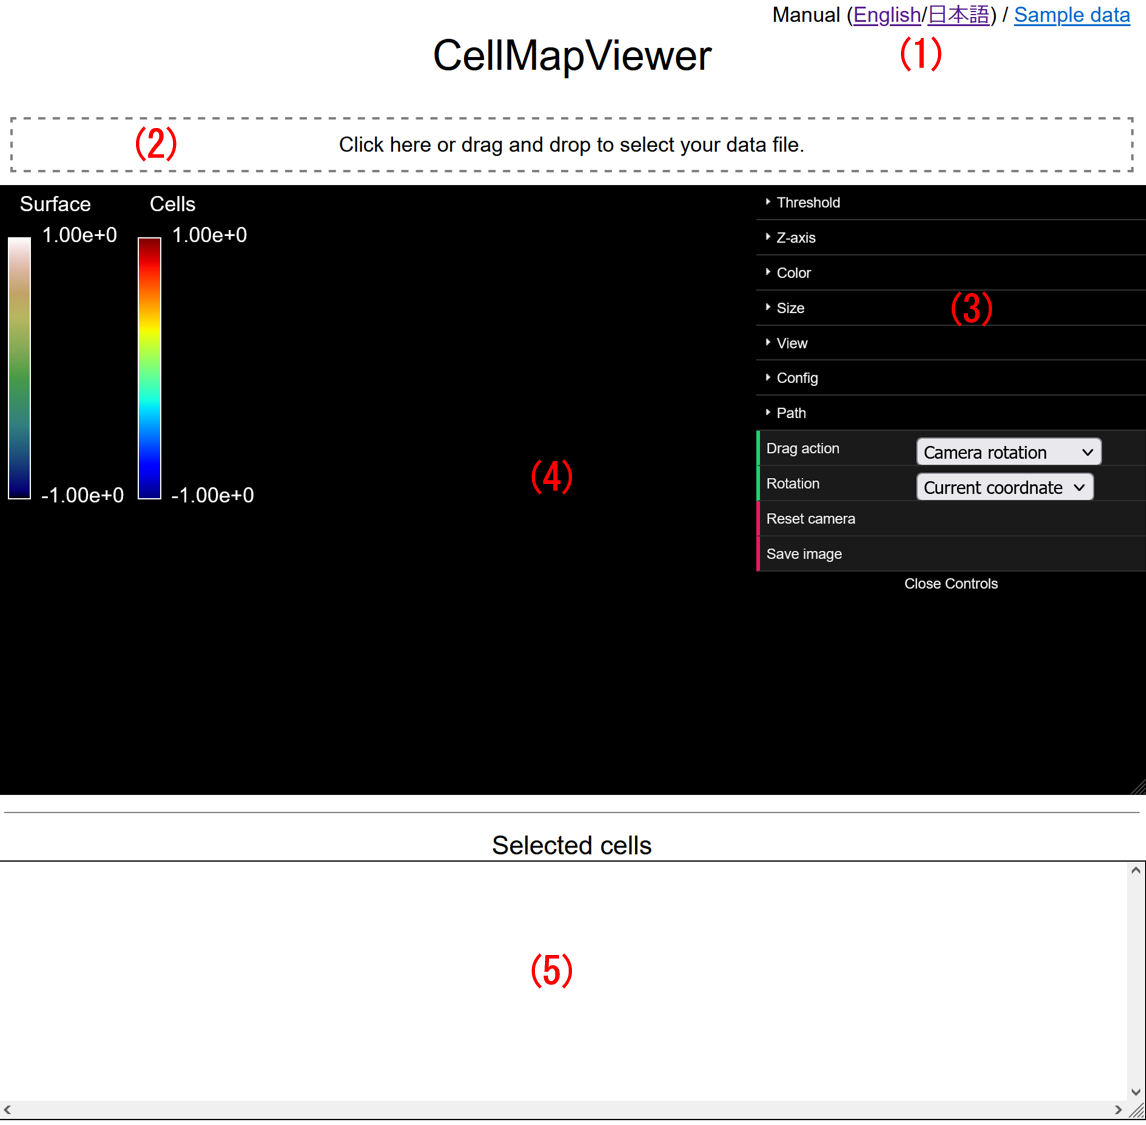
When clicked, the file dialog is shown to select the input file. You can also drag and drop the input file here. When visualizing data, the file name is shown above this area.
The menu for configurations and operations. For details, see "Configuring visualization" for [Threshold], [Z-axis], [Color], [Size], [View], [Config], [Drag action] and [Rotation], "Controlling the viewpoint" for [Reset camera], "Finding a path" for [Finding 2D (3D) path], and "Taking a screenshot" for [Save image]. The menu can be closed (opened) by clicking [Close (Open) Controls].
Can be controlled with the mouse. The height can be adjusted by dragging the right-bottom corner (not supported in Safari) or the horizontal line below. See "Controlling the viewpoint" for details.
Displays the information and the statistics of the selected cells. The height can be adjusted by dragging the right-bottom corner. See "Showing of the selected cells' information" for details. Clicking on the number of cells, displayed on the right of "Selected cells", saves the contents of the table in CSV format.
The input file must:
- be a text file;
- be encoded in UTF-8;
- be CSV-formatted using comma (",") as a delimiter;
- have the header describing the column names as the first line;
- describe each single cell data in each single line below the first one;
- have lines with the equal number of columns;
- have no redundancy in the column names;
- have cell names in the first column (header string is optional);
- have data columns for cell x coordinates, y coordinates, and potential from the second column onwards;
- have the header string 'X' in the data column for the cell's x coordinates;
- have the header string 'Y' in the data column for the cell's y coordinates;
- have the header string 'Potential' in the data column for the cell's potential;
- contain 0 or more cell annotation data columns;
- have the header string for the cell's annotation in the format of 'Annotation' or 'Annotation_', 'Annote_', 'Ann_' or 'A_' followed by at least one alphanumeric character;
- contain 0 or more sets of velocity vector data, with 1 set of x-direction data and y-direction data;
- contain the velocity vector data column, the x direction data column and the y direction data column, side by side in that order;
- have the header string of data columns of velocity vectors in the form of 'label_x' and 'label_y';
- have finite numbers in the columns other than cell name and cell type; and
- have columns that do not match the above header strings as features (numerical values) that are candidates for z coordinates.
If these requirements are not satisfied, the file will cause errors, be read incorrectly or be garbled. Empty lines and lines containing only whitespace characters are skipped. Column names are interpreted regardless of the characters' case and the presence of white spaces.
Also, by placing the contents of the input file, written in the specified format below, in the "initialData.js" file that is available in the js folder of this program, the input contents will be automatically visualized when the program starts. The format of the "initialData.js" file is as follows:
- The first line is 'window.initialData = {'
- The second line is ' "fileName":"<any file name>" '
- The third and subsequent lines are ' "data": `Contents of input file (CSV-formatted string)` '
- The last line is '};'
Once the input file is selected via file selection area, the data is automatically displayed based on the current settings.
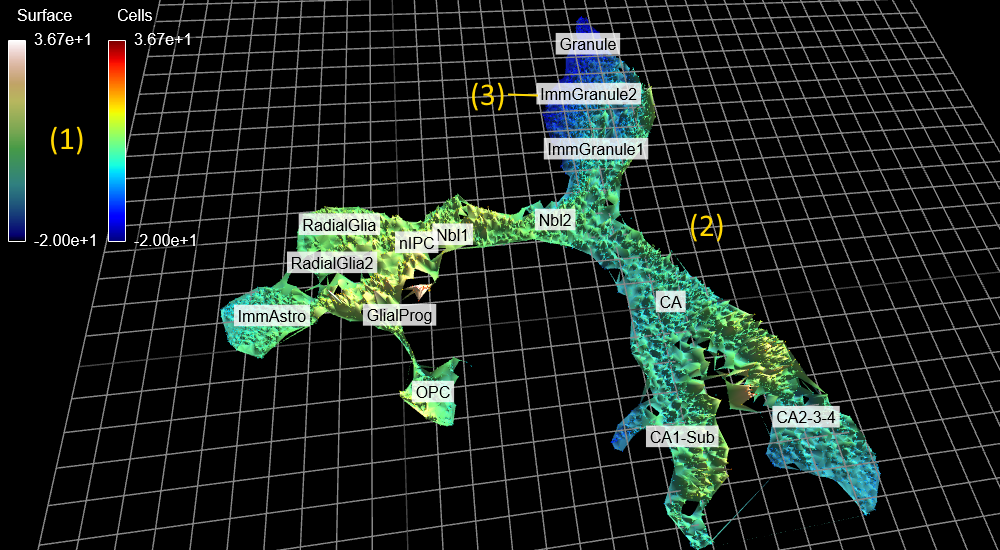
The color map with the maximum and the minimum values of the feature selected in [Color] > [Surface] and [Color] > [Cells].
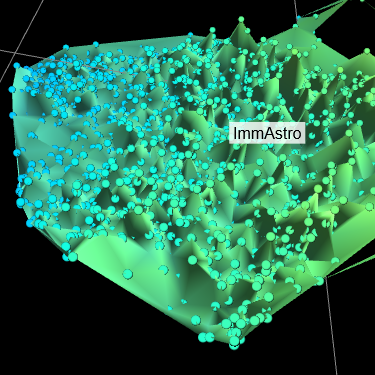
The Delaunay triangulation excluding the triangles thresholded based on the [Threshold] settings. The surface color represents the feature value specified in [Color] > [Surface] > [Feature] at the color map specified in [Color] > [Surface] > [Color map] within the range specified in [Color] > [Surface] > [Min]/[Max]. The cell points are displayed as the enlarged view below. Color of the cell points is specified as the same way in [Color] > [Cells], independent from the [Color] > [Surface].
If the input data contain "Annotation" column, [View] displays a list of "Annotation" columns that can be selected. If you specify the "Annotation" column, the annotation label will be displayed at the average position of the cell population belonging to each annotation. By clicking the label, you can select the cells with the annotation of the label. When the Shift, Ctrl (for Windows) or Command (for mac) key is pressed at the same time, the cells of the annotation are added to the already selected cells.
- Do Delaunay-triangulation for the cell points in the input data at the xy plane.
- Exclude specific triangles from the triangles that make up 1. The excluded triangles are the union of the set of triangles with the top s% of the volume and with the top t% of the longest edge. (where s and t are the values set in [Threshold])
- Let the z coordinates of the cell points be the feature values as specified in [Z-axis] > [Feature], and when displayed, scale the z coordinates to the scale as specified in [Z-axis] > [Scale].
- Colorize the surface and the cell points as described in "Reading a cell map".
The next figure shows the expanded menu.
The settings in the menu are described below.
The threshold for the exclusion of the triangles in the Delaunay triangulation. See "Algorithm for visualization" for details.
The feature for the z coordinates of the cell points for [Feature], and its scale for [Scale]. [Grid] sets the z coordinates of the grid.
The coloring of the surface of the cell map. [Min]/[Max] can be set to the minimum/maximum value of [Feature] from [Set min/max to feature range] button. See "Reading a cell map" for details.
The coloring of the cell points, similar to the [Surface].
The color picker for the mesh (the edges of the triangulated triangles) of the cell map.
The color picker for the streamlines of the cell map.
The color picker for the contours of the cell map.
The color picker for the background of the cell map-displayed area.
The font size of the annotations.
The size of the cell points.
The size of the selected cell points.
The width of the path.
The width of the contours.
Whether to display the label of the annotation.
Switches the annotation type.
Whether to display the surface and the corresponding color bar.
Whether to display the mesh.
Whether to display the cell points and the corresponding color bar.
Whether to highlight the selected cell points.
Whether to display the streamlines.
Switches the velocity type for displaying streamlines.
Change the number of contours displayed.
Whether to display the grid.
Resets all the settings above to the default.
Displays the Open File dialog and loads the selected configuration file.
Download the configuration file in JSON format.
Search without considering the z coordinates. See "Finding a path" for details.
Search considering the z coordinates. See "Finding a path" for details.
Change the parameter for searching the path considering z coordinates. See "Finding a path" for details.
The mode for the mouse drag with the left button down on the cell map-displayed area. See "Controlling the viewpoint" and "Selection by drag" for details.
Specifies the center of the viewpoint when dragging while holding down the left mouse button at the cell map-displayed area. See "Controlling the viewpoint" and "Selection by drag" for details.
You can rotate, zoom in/out and pan on the cell map-displayed area by the mouse. Click [Reset camera] to go back to the initial viewpoint.
Set [Drag action] to [Camera rotation] and drag with the left button down to rotate the viewpoint.
Scroll to zoom in/out (with the mouse's scroll wheel or touch pad equivalent motion).
Drag with the right button down to pan.
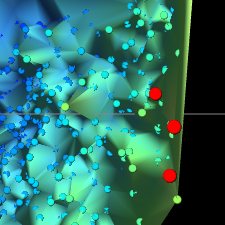
You can select cells by click or drag. Selected cells are highlighted in red as shown in the next figure.
When a cell point is clicked, the cell is selected and the others are deselected. When a cell is clicked with the Shift, Ctrl (for Windows) or Command (for mac) key pressed, the cell is added to the already selected cells.
When dragged with [Drag action] set to [Rectangle selection], the cells within the rectangle are selected and the others are deselected. When dragged with the Shift, Ctrl (for Windows) or Command (for mac) key pressed, the cells within the rectangle are added to the already selected cells.
You can select cells by an annotation. See "Annotation" for details.
The information of the selected cells are displayed in a table form in the selected-cell information area. The data in the input file such as coordinates and feature values are shown in one line for one cell. In addition, the following statistics of the selected cells is shown at the bottom of the table: minimum, maximum, mean, variance, standard deviation (SD) and coefficient of variation (CV).
When two cell points are selected, you can find the shortest path between the points by [Path] commands. Searched edges are the ones that are currently drawn. The Euclidean distance on the xy plane is used. When the path is found, the path is shown in red and the cells on the path get selected. When a path is not found, a message is displayed in a dialog.
Executed by clicking [Find 2D path]. The algorithm uses only x and y coordinates.
Executed by clicking [Find 3D path]. The algorithm tries to find the shortest path where the z coordinate monotonically increases or decreases. The search is performed using an algorithm that weights the search more heavily when the z coordinate increases than when the z coordinate decreases. The value of the register set in [Register for 3D path] is the value that controls the ratio of weights in decreasing and in increasing. Searching when the value of register is 0 is equivalent to path search regardless of z coordinate.
If [Register for 3D path] is changed while the path is displayed, the value of register is changed and recalculated to display the newly obtained path. Even if the route being displayed is in a state where path search regardless of z coordinate was performed, the value of register is changed and path search regarding of z coordinates is performed.
When the path is found, a line chart with the selected cells on the horizontal axis and the selected feature on the vertical axis is displayed at the bottom of the selected-cell information, as shown in the figure below. The displayed feature can be changed dynamically by changing [Z-axis] > [Feature] while the graph is displayed.
You can save a screenshot of the cell map-displayed area excluding the menu area in PNG format by clicking [Save image].


