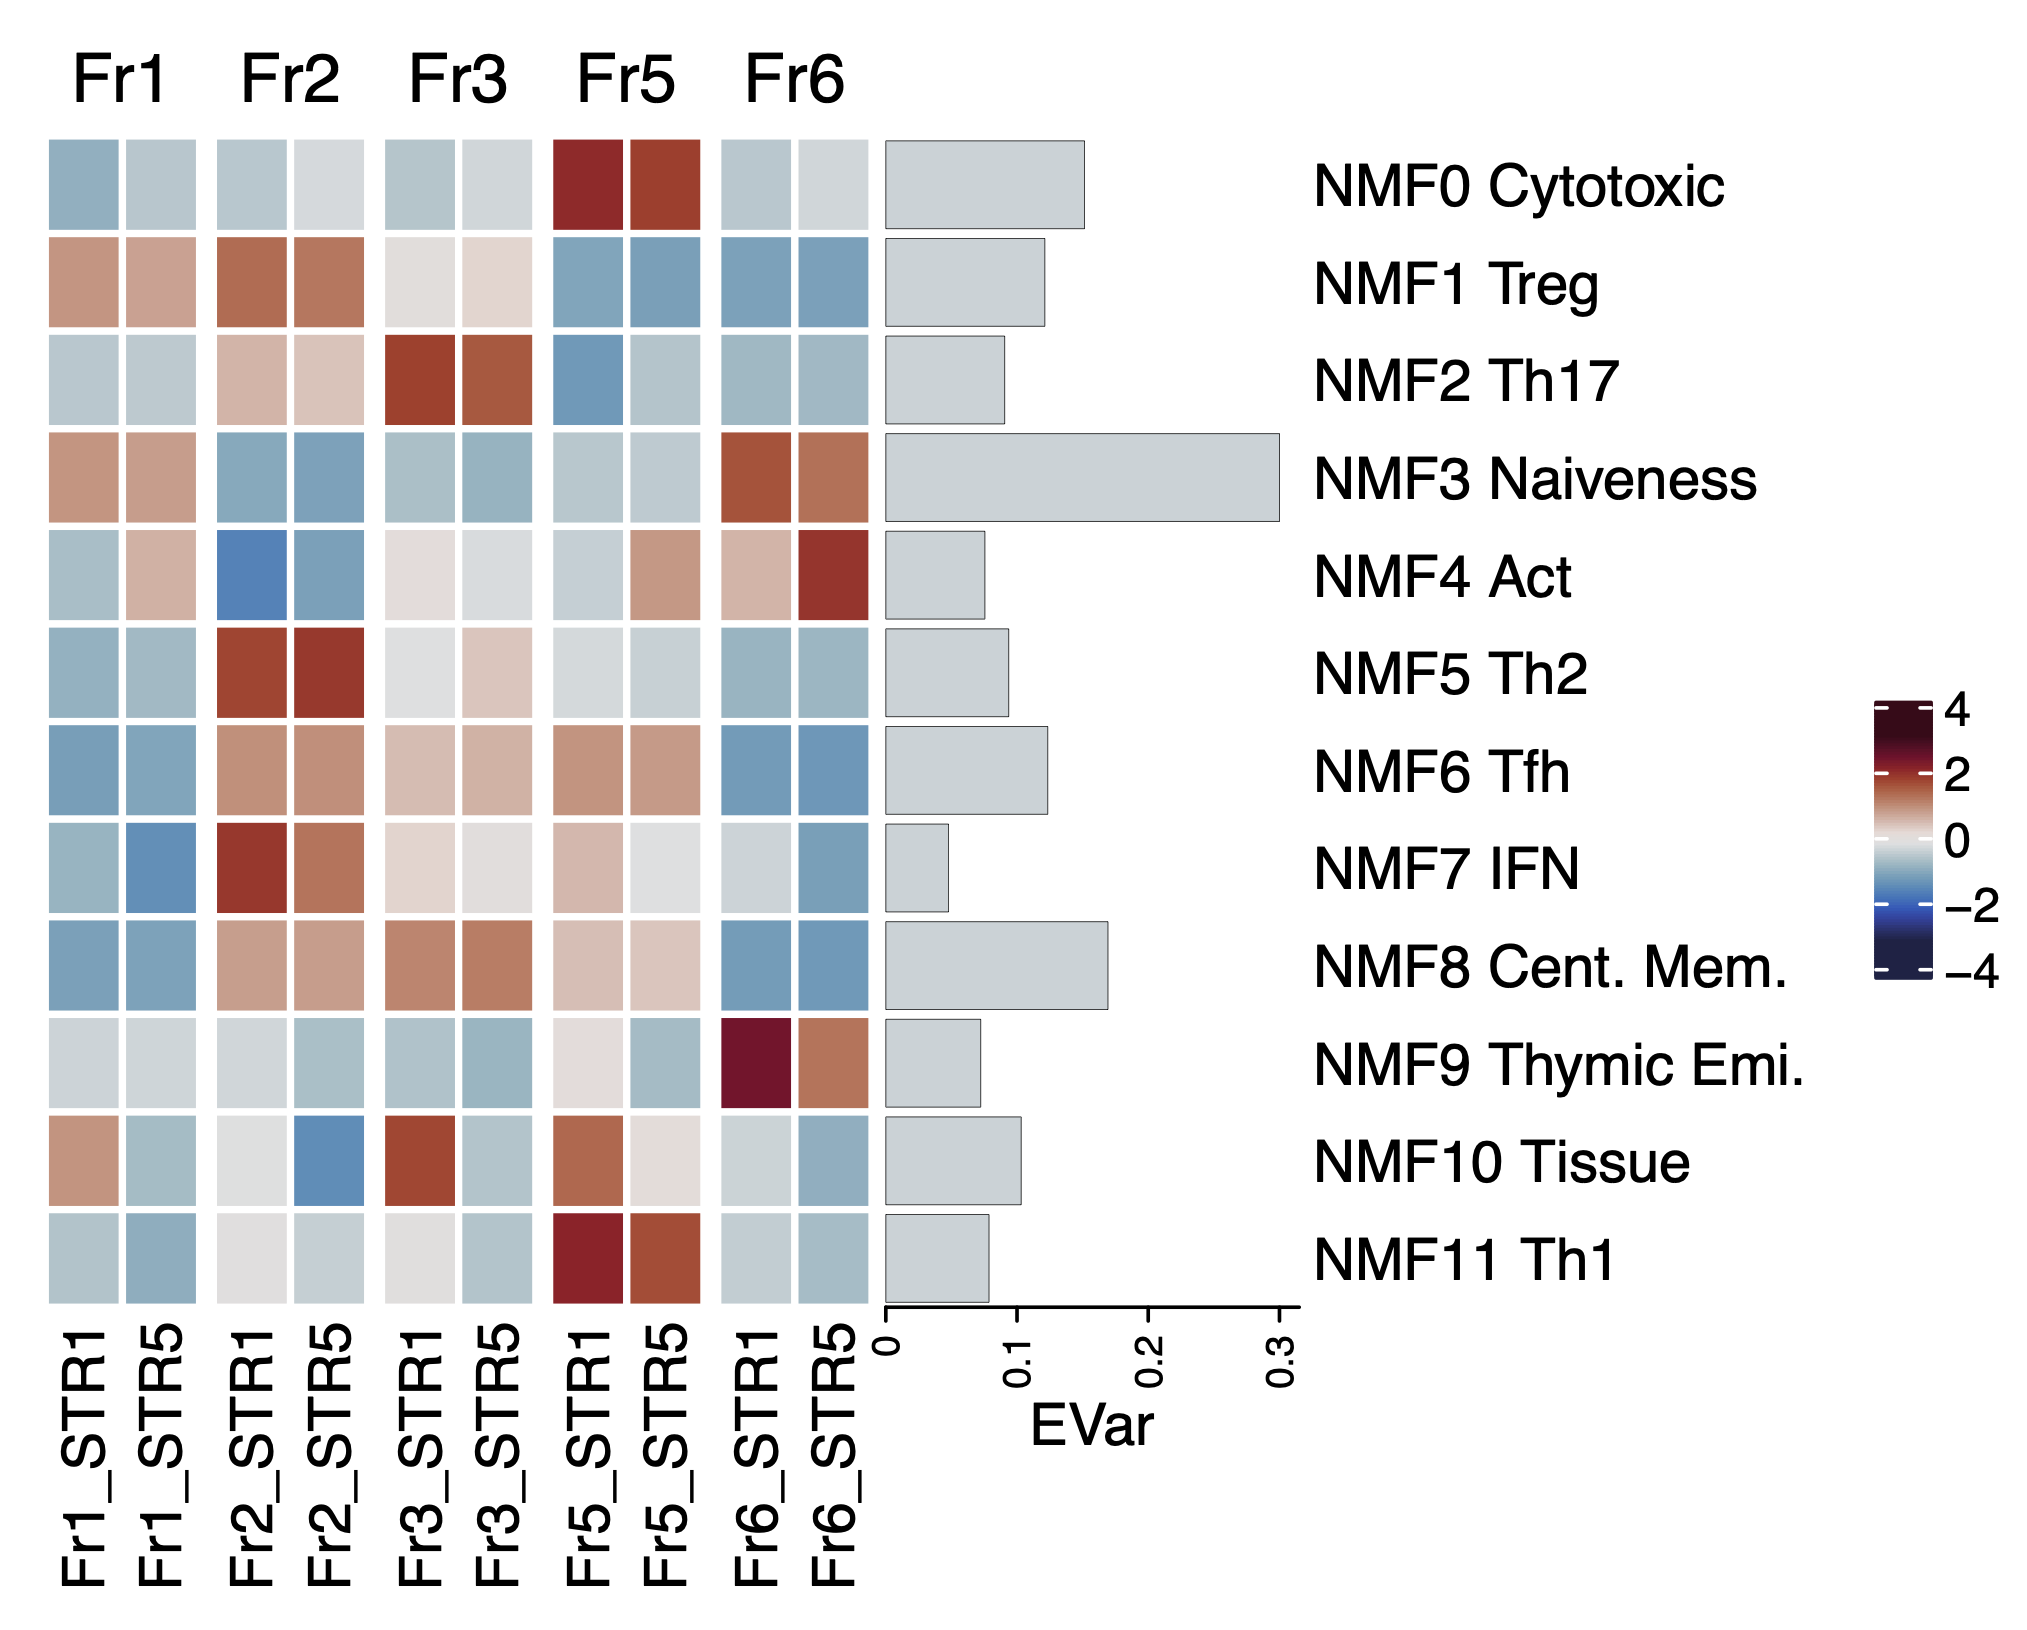
Perform NMF decomposition with pre-computed matrix W. For UMI-based pre-computed matrix, input gene expression should be UMI count, scaledTPM or TPM.
After installing python3,
pip install --user numpy scipy pandas scikit-learn scanpy
git clone https://github.com/yyoshiaki/NMFprojection.git
cd NMFprojection
pip install -e .
or
pip install git+https://github.com/yyoshiaki/NMFprojection.git
usage: NMFproj [-h] [--outputprefix OUTPUTPREFIX] [--normalized] [--scale_output] [--min_mean MIN_MEAN] [--max_mean MAX_MEAN] [--min_disp MIN_DISP]
               [--n_top_genes N_TOP_GENES] [--off_calc_hvg_overlap] [--save_fullhvgstats] [-v]
               input fixedW

NMFproj

positional arguments:
  input                 input csv/tsv of gene expressions. UMI, scaledTPM, TPM can be used. Row: genes, Columns: samples.
  fixedW                input csv/tsv/npz(cNMF) of precomputed W. Row: genes, Columns: components.

optional arguments:
  -h, --help            show this help message and exit
  --outputprefix OUTPUTPREFIX
                        output prefix. default=NMF
  --normalized          if normalized and log transformed, specify this flag.
  --scale_output        if scale output, specify this flag. default=False
  --min_mean MIN_MEAN   parameter for calculation of HVGs overlap
  --max_mean MAX_MEAN   parameter for calculation of HVGs overlap
  --min_disp MIN_DISP   parameter for calculation of HVGs overlap.
  --n_top_genes N_TOP_GENES
                        parameter for calculation of HVGs overlap.
  --off_calc_hvg_overlap
                        turn off calc_hvg_overlap
  --save_fullhvgstats   save full stats of hvg (hvg_overlap).
  -v, --version         Show version and exit
example
NMFproj \
    --outputprefix test/STR1.5_Fr1.2.3.5.6 \
    test/STR1.5_Fr1.2.3.5.6_scaledTPM.tsv \
    data/NMF.W.CD4T.csv.gz
Users can import NMFprojection and run it in python codes.
from NMFproj import *

X_norm, X_trunc, df_H, fixed_W_trunc = NMFproj(X, fixed_W, return_truncated=True, normalized=True)
df_ev = calc_EV(X_trunc, fixed_W_trunc, df_H)
df_stats = calc_hvg_overlap(X_norm, fixed_W_trunc, min_mean=0.0125, max_mean=3, min_disp=0.1,
                            n_top_genes=500)
print('\n## Stats of overlap of HVGs')
msg = 'Num. genes in fixed W: %s \n' % fixed_W.shape[0]
msg += 'Num. Retained genes (Prop.): %s (%s)\n' % (fixed_W_trunc.shape[0], fixed_W_trunc.shape[0]/fixed_W.shape[0])
msg += 'Prop. overlap of HVGs (POH) : {} in {} query HVGs'.format(
    df_stats.loc[df_stats['highly_variable'], 'selected'].sum() / df_stats['highly_variable'].sum(),
    df_stats.highly_variable.sum())
print(msg)
Human CD4T cell (pan-autoimmune peripheral CD4T, yasumizu et al., unpublished, UMI-based) : data/NMF.W.CD4T.csv.gz
- Factors : 'NMF0 Cytotoxic-F', 'NMF1 Treg-F', 'NMF2 Th17-F', 'NMF3 Naive-F', 'NMF4 Act-F', 'NMF5 TregEff/Th2-F', 'NMF6 Tfh-F', 'NMF7 IFN-F', 'NMF8 Cent. Mem.-F', 'NMF9 Thymic Emi.-F', 'NMF10 Tissue-F', 'NMF11 Th1-F'
Mouse CD4T cell (pan-autoimmune peripheral CD4T, converted to mouse, yasumizu et al., unpublished, UMI-based) : data/NMF.W.CD4T.converted.mouse.csv.gz
Genes were mapped to mouse genes from NMF.W.CD4T.csv.gz using the mouse-human homolog list.
- Factors : 'NMF0 Cytotoxic-F', 'NMF1 Treg-F', 'NMF2 Th17-F', 'NMF3 Naive-F', 'NMF4 Act-F', 'NMF5 TregEff/Th2-F', 'NMF6 Tfh-F', 'NMF7 IFN-F', 'NMF8 Cent. Mem.-F', 'NMF9 Thymic Emi.-F', 'NMF10 Tissue-F', 'NMF11 Th1-F'
Please refer to the tutorial https://github.com/yyoshiaki/NMFprojection/blob/main/PBMC.ipynb to make a custom gene feature matrix.
Users can also use gene feature matrix (Gene Expression Programs / GEPs) defined by cNMF. NMFproj use consensus GEPs before the refit (e.g. XXX.spectra.k_X.dt_XXX.consensus.df.npz in cnmf_tpm directory). Please refere to the notebook https://github.com/yyoshiaki/NMFprojection/blob/main/cNMF/cNMF_PBMC.ipynb.
- *_projection.csv : decomposited H
- *_ExplainedVariance.csv : explained variances (last row indicates Evar of all components)
- *_RMSE.csv : RMSE
- *_hvgstats.txt : stats for hvg_overlap (including POH)
- (*_hvgstats.csv : full stats for hvg_overlap)
We assume NMF W is calculated for highly variable genes (HVGs). To examine whether the selected HVGs of fixed W can capture HVGs in a query dataset, we calculate the proportion of the number of HVGs included in fixed W against the number of HVGs of the qery dataset as POH (Proportion of Overlapped HVGs). sc.pp.highly_variable_genes in scanpy is used for the calcuration of HVGs of the query datasets. In default settings, 500 is used for the number of query HVGs.
- Python==3.9.16
- numpy==1.21.6
- scipy==1.9.1
- pandas==1.4.4
- scikit-learn==1.0.2
- scanpy==1.9.1
library(tidyverse)
library(ComplexHeatmap)
library(circlize)
library(pals)

# setwd("~/NMFprojection")
df.proj <- read.csv("test/STR1.5_Fr1.2.3.5.6_projection.csv", row.names = 1)
df.evar <- read.csv("test/STR1.5_Fr1.2.3.5.6_ExplainedVariance.csv", row.names = 1)

row.labels <- c('NMF0 Cytotoxic-F', 'NMF1 Treg-F', 'NMF2 Th17-F', 'NMF3 Naive-F',
                'NMF4 Act-F', 'NMF5 Th2-F', 'NMF6 Tfh-F', 'NMF7 IFN-F', 'NMF8 Cent. Mem.-F',
                'NMF9 Thymic Emi.-F', 'NMF10 Tissue-F', 'NMF11 Th1-F')

# raw value
anno = row_anno_barplot(
  df.evar$ExplainedVariance[1:dim(df.evar)[1]-1],
  border = FALSE, bar_width = 0.9,
  gp = gpar(fill = cividis(10)[4], lwd = 0),
  width = unit(3, "cm"))
Heatmap(df.proj, name=" ",
        row_order = rownames(df.proj), column_order = colnames(df.proj),
        right_annotation = rowAnnotation(EVar = anno, simple_anno_size = unit(4, "cm")),
        col = cividis(40), row_labels = row.labels,
        rect_gp = gpar(col = "white", lwd = 2),
        width = ncol(df.proj)*unit(3, "mm"),
        height = nrow(df.proj)*unit(5, "mm")
)

# scaled value
anno = row_anno_barplot(
  df.evar$ExplainedVariance[1:dim(df.evar)[1]-1],
  border = FALSE, bar_width = 0.9,
  gp = gpar(fill = ocean.balance(10)[5], lwd = 0),
  width = unit(3, "cm"))
p <- Heatmap(t(scale(t(df.proj))), name=" ",
             row_order = rownames(df.proj), column_order = colnames(df.proj),
             right_annotation = rowAnnotation(EVar = anno, simple_anno_size = unit(4, "cm")),
             col = colorRamp2(seq(-3, 3, length = 20), ocean.balance(20)),
             row_labels = row.labels,
             rect_gp = gpar(col = "white", lwd = 2),
             width = ncol(df.proj)*unit(5, "mm"),
             height = nrow(df.proj)*unit(5, "mm"),
             column_split = colnames(df.proj) %>% str_extract("Fr.")
)
p

pdf("test/STR1.5_Fr1.2.3.5.6_heatmap_zscore.pdf")
p
dev.off()
Yasumizu, Yoshiaki, Daiki Takeuchi, Reo Morimoto, Yusuke Takeshima, Tatsusada Okuno, Makoto Kinoshita, Takayoshi Morita, et al. 2023. “Single-Cell Transcriptome Landscape of Circulating CD4+ T Cell Populations in Human Autoimmune Diseases.” bioRxiv. https://doi.org/10.1101/2023.05.09.540089.
This software is freely available for academic users. Usage for commercial purposes is not allowed. Please refer to the LICENCE page.

