scDRS (single-cell disease-relevance score) is a method for associating individual cells in single-cell RNA-seq data with disease GWASs, built on top of AnnData and Scanpy.
Read the documentation: installation, usage, command-line interface (CLI), file formats, etc.
Check out instructions for making customized gene sets using MAGMA.
Zhang*, Hou*, et al. "Polygenic enrichment distinguishes disease associations of individual cells in single-cell RNA-seq data", Nature Genetics, 2022.
- v1.0.3: development version. Fixing a bug of negative values of
ct_meanwhen--adj-propand--covare on and there are genes extremely low expression; print--adj-propinfo inscdrs compute-score; check p-value and z-score files that the gene column should have headerGENE; force index in df_cov and df_score to be str; add --min-genes and --min-cells in CLI for customized filtering; adjustable FDR threshold for plot_group_stats martinjzhang#75. - v1.0.2: latest stable version. Bug fixes on
scdrs.util.plot_group_stats; input checks inscdrs munge-gsandscdrs.util.load_h5ad.
- v1.0.1: stable version used in publication. Identical to
v1.0.0except documentation. - v1.0.0: stable version used in revision 1. Results are identical to
v0.1for binary gene sets. Changes with respect tov0.1:- scDRS command-line interface (CLI) instead of
.pyscripts for calling scDRS in bash, includingscdrs munge-gs,scdrs compute-score, andscdrs perform-downstream. - More efficient in memory use due to the use of sparse matrix throughout the computation.
- Allow the use of quantitative weights.
- New feature
--adj-propfor adjusting for cell type-proportions.
- scDRS command-line interface (CLI) instead of
- v0.1: stable version used in the initial submission.
See scDRS_paper for more details (experiments folder is deprecated). Data are at figshare.
- Download GWAS gene sets (.gs files) for 74 diseases and complex traits.
- Download scDRS results (.score.gz and .full_score.gz files) for TMS FACS + 74 diseases/trait.
Older versions
- Initial submission: GWAS gene sets and scDRS results.
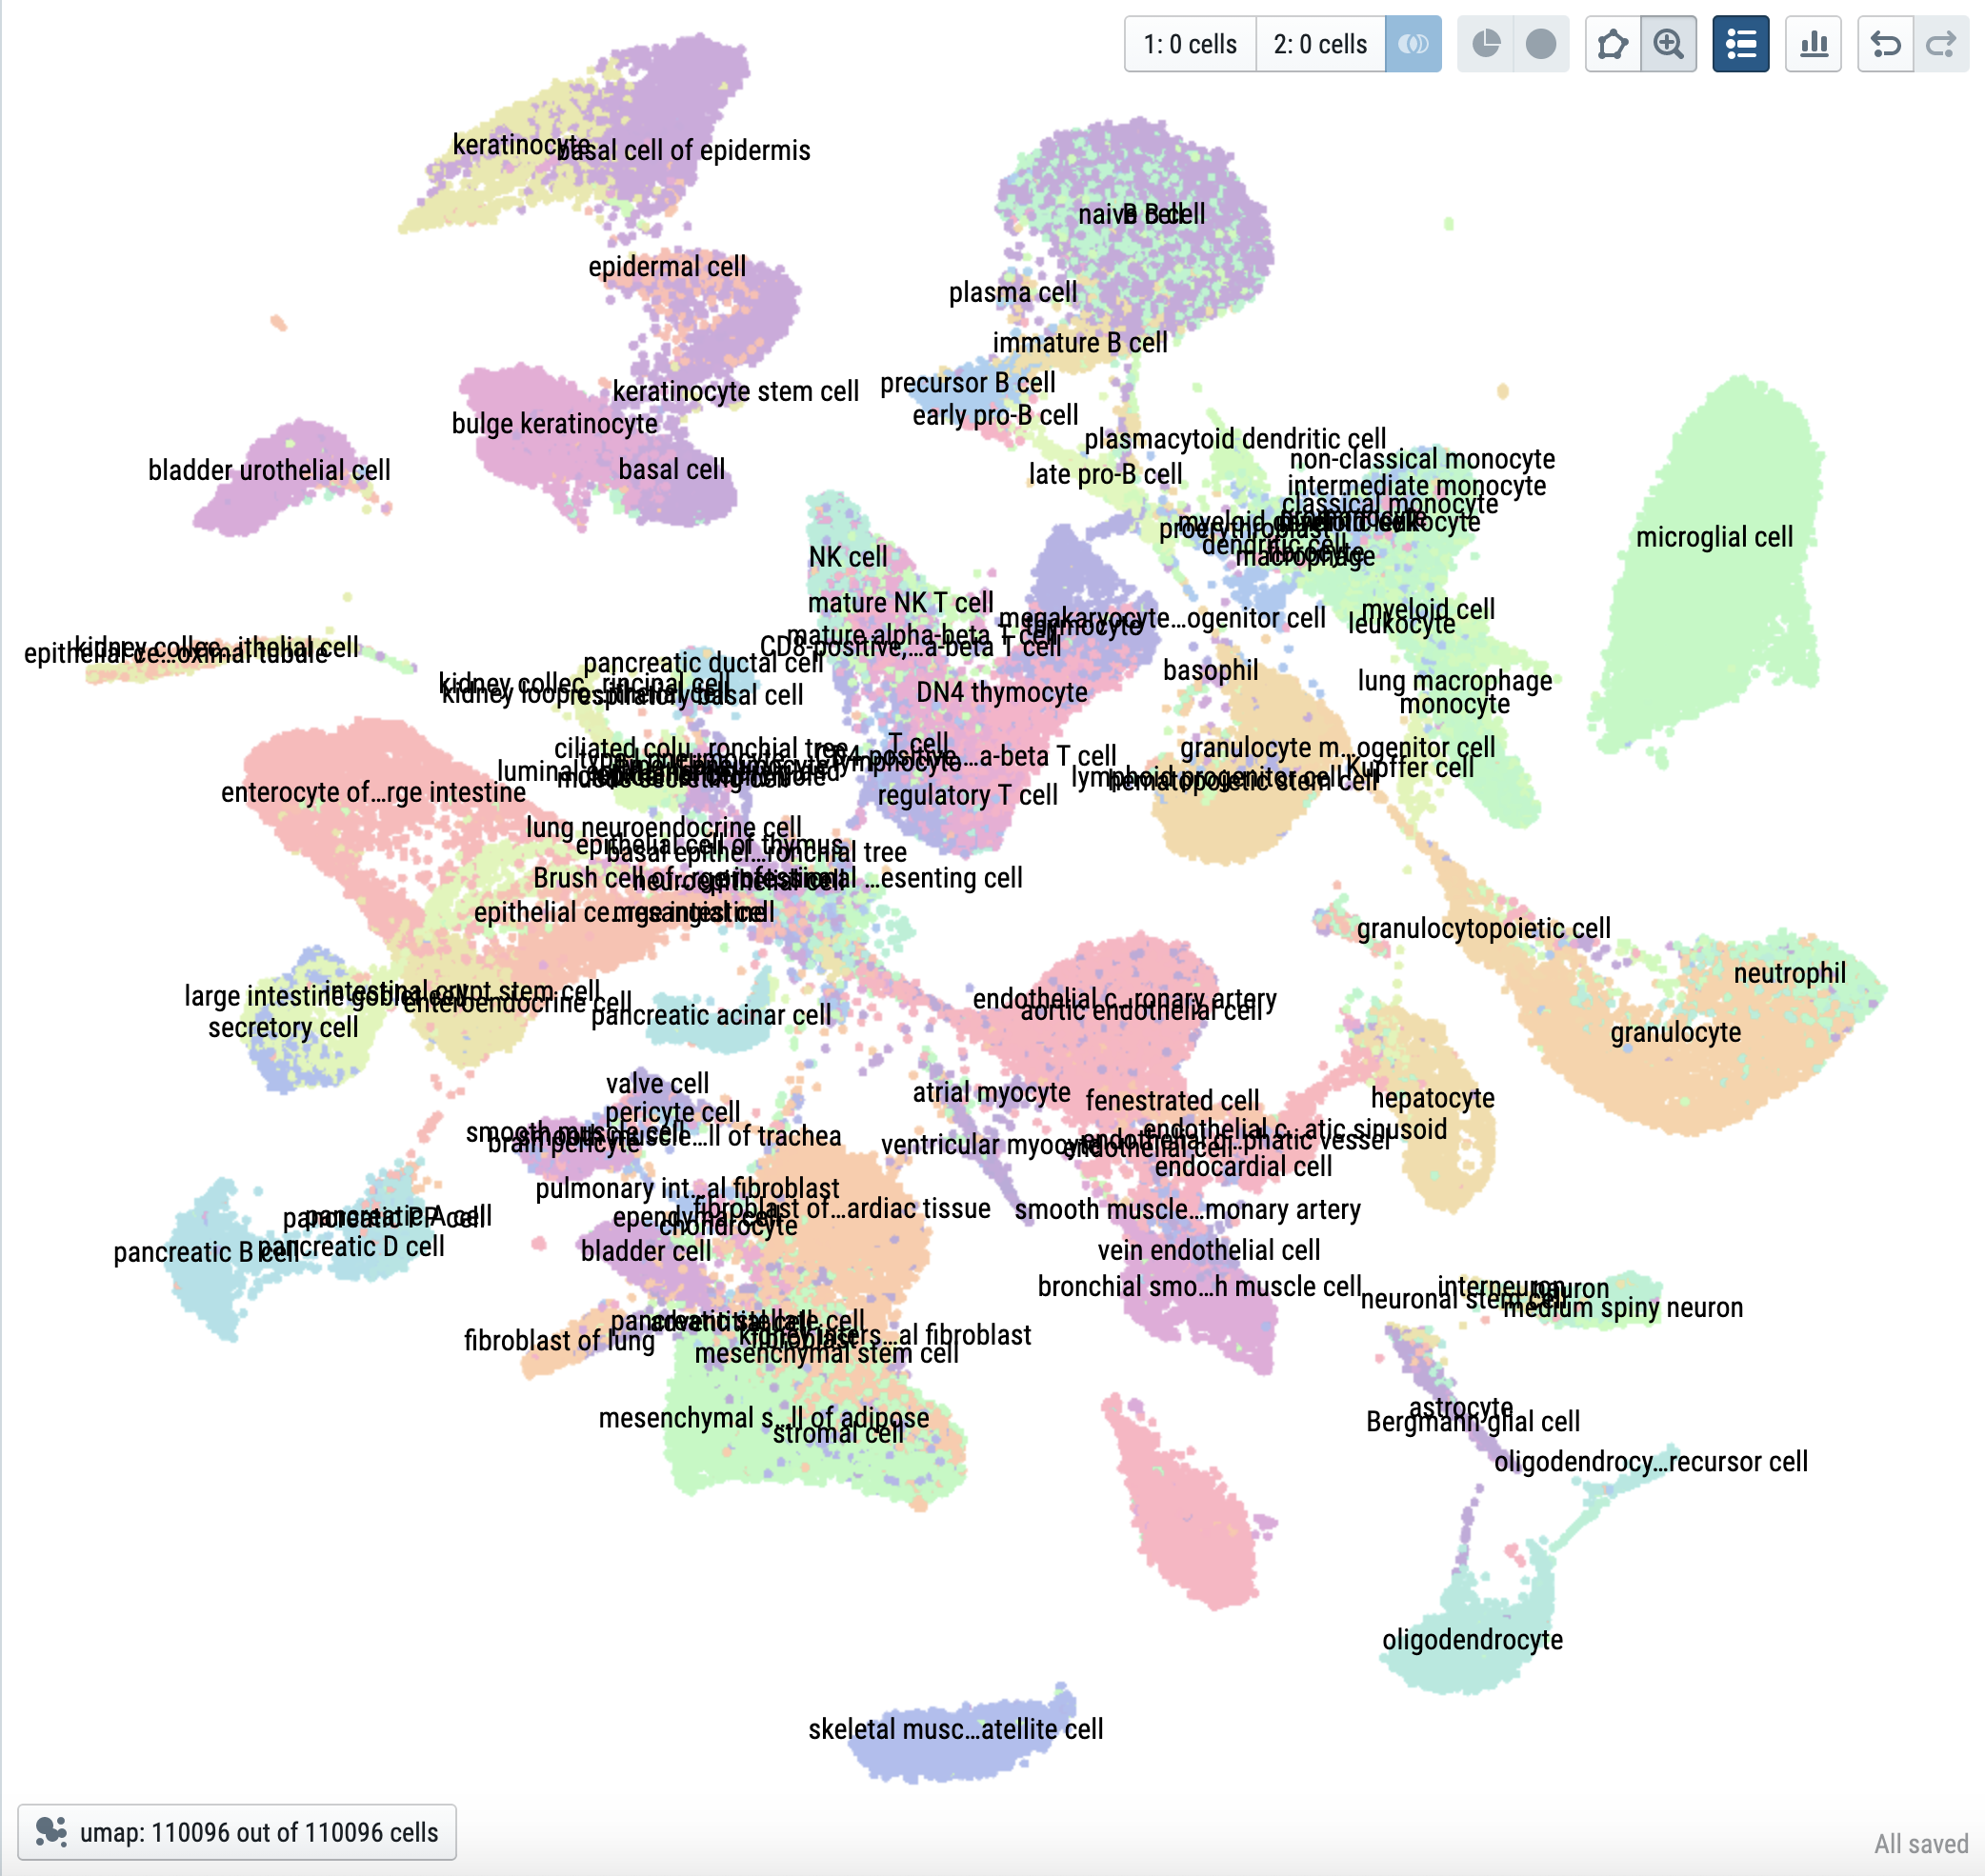
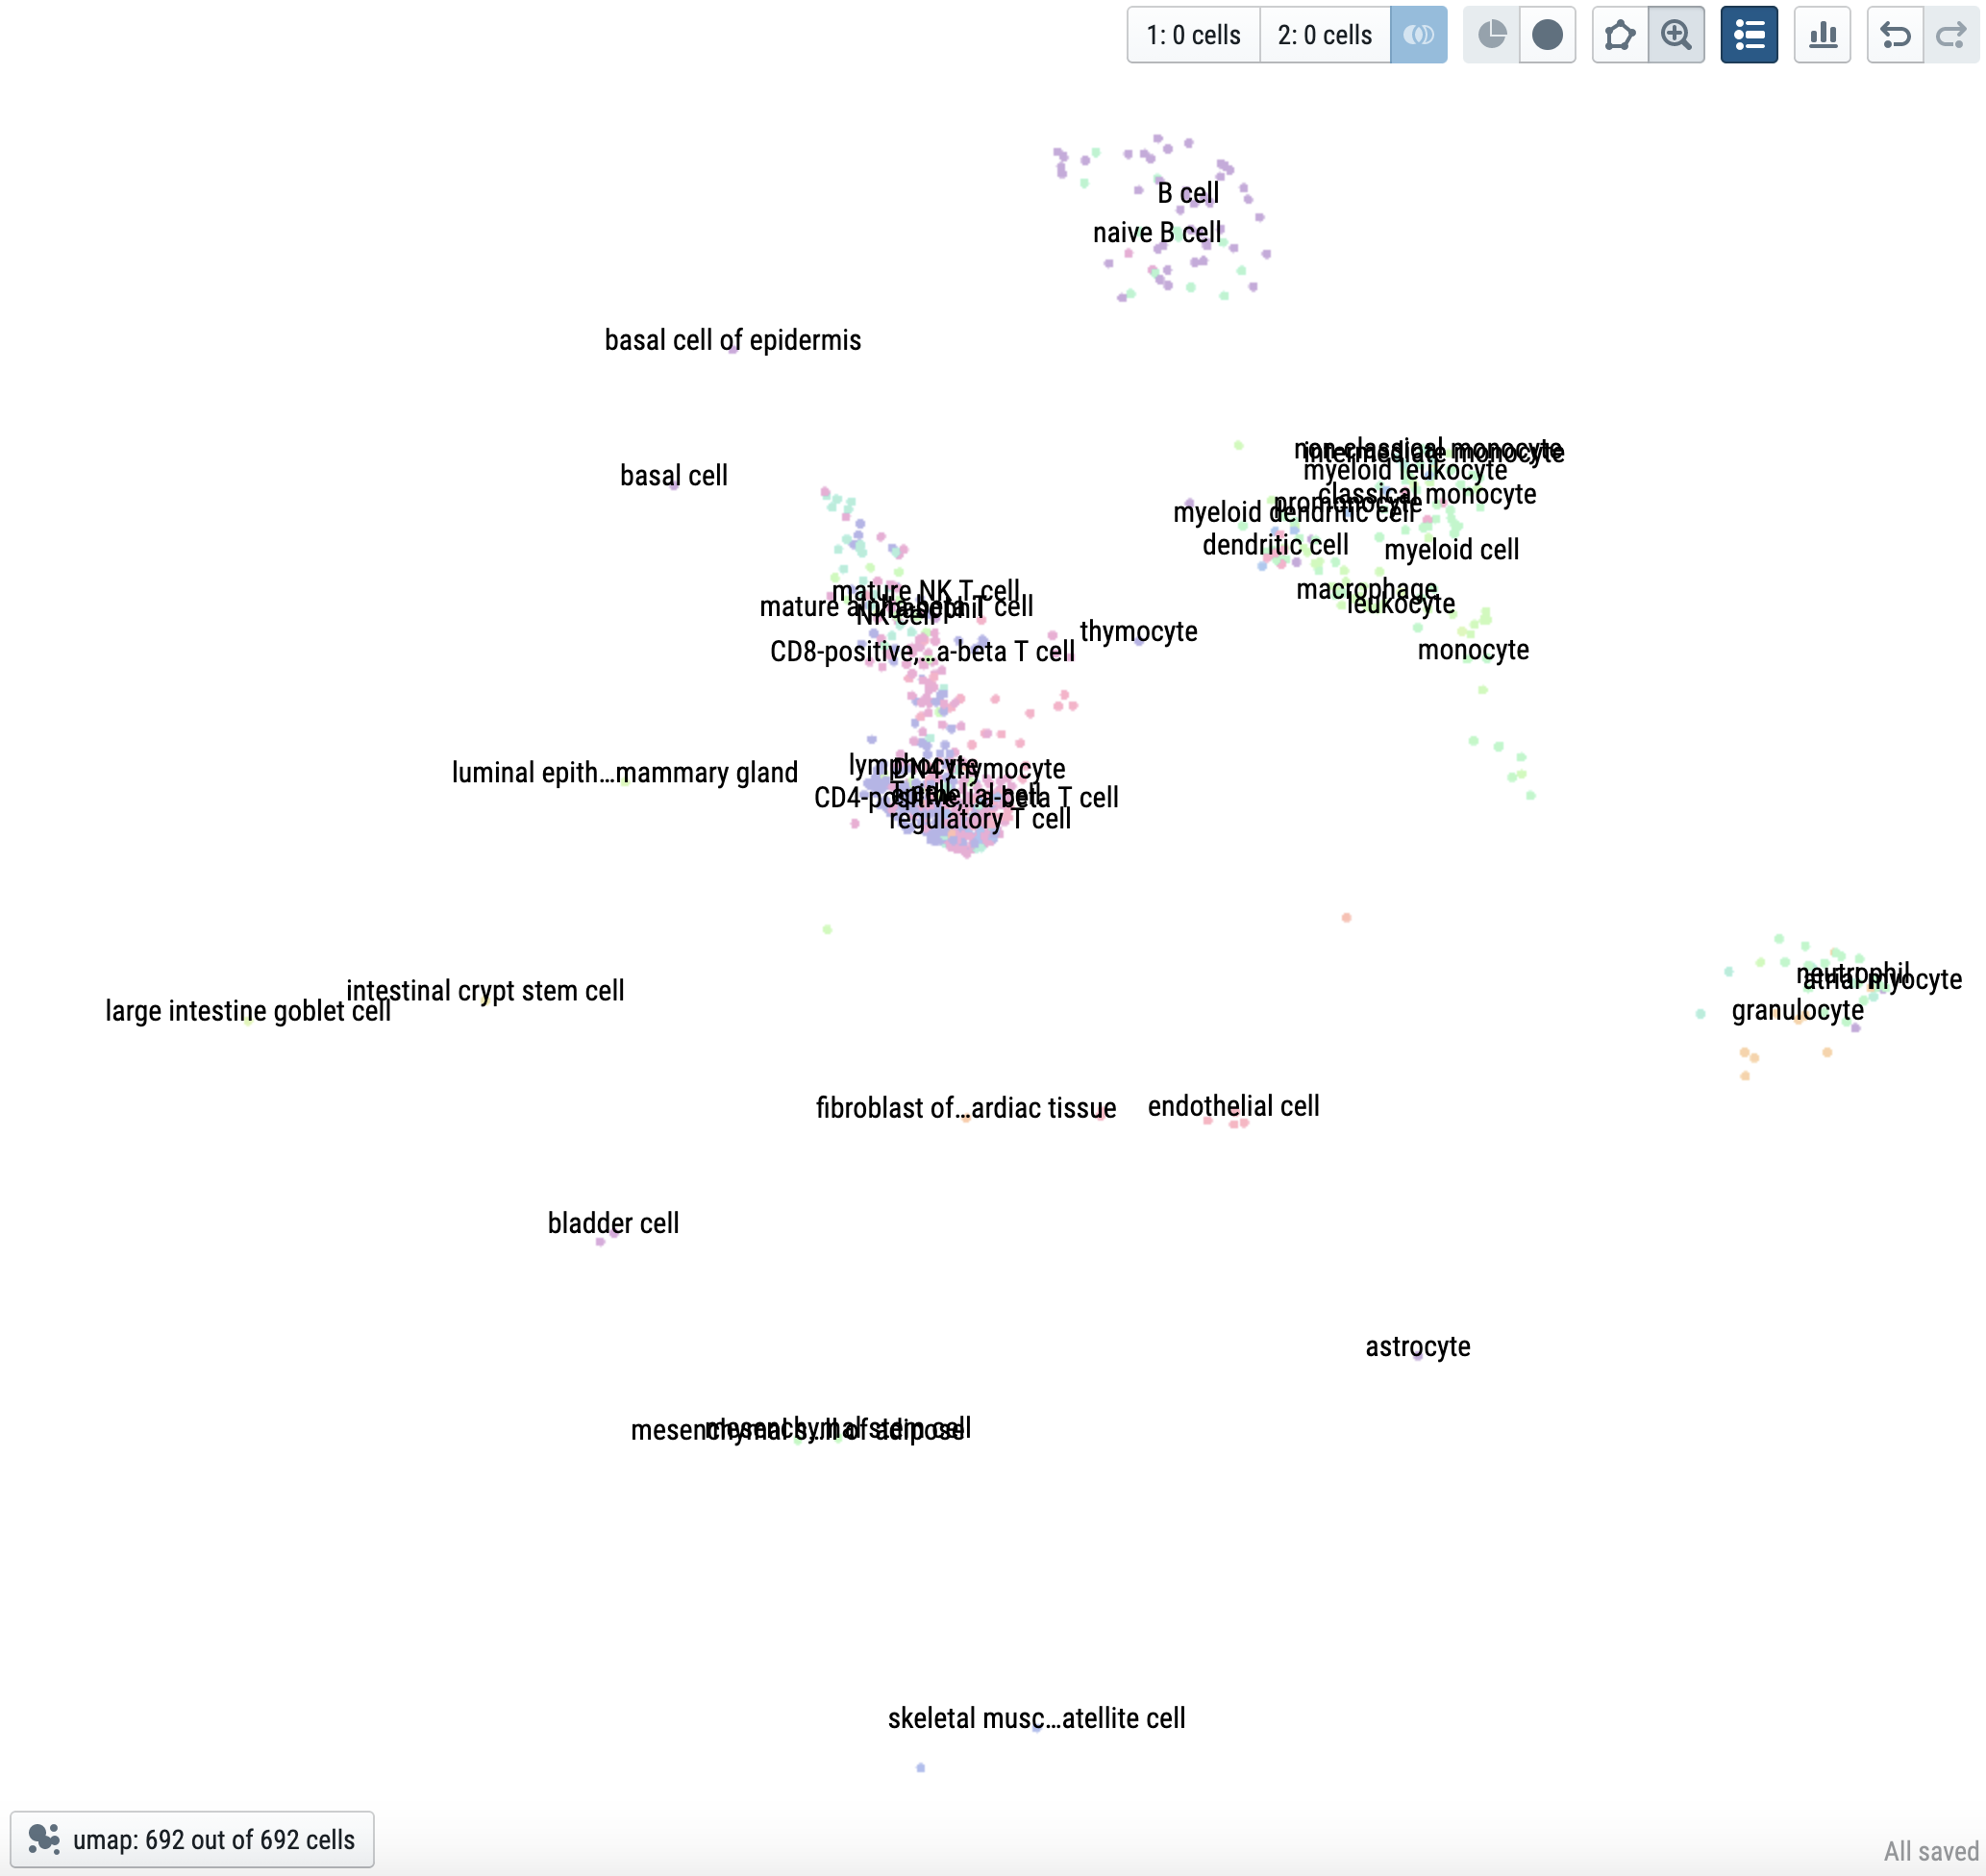
Explore scDRS results via CELLxGENE
- h5ad files compatible with CELLxGENE
- Instructions on running CELLxGENE
 |
 |
|---|---|
| 110,096 cells from 120 cell types in TMS FACS | IBD-associated cells |
NOTE: scDRS scripts are still maintained but deprecated. Consider using scDRS command-line interface instead.
Input: scRNA-seq data (.h5ad file) and gene set file (.gs file)
Output: scDRS score file ({trait}.score.gz file) and full score file ({trait}.full_score.gz file) for each trait in the .gs file
h5ad_file=your_scrnaseq_data
cov_file=your_covariate_file
gs_file=your_gene_set_file
out_dir=your_output_folder

python compute_score.py \
    --h5ad_file ${h5ad_file}.h5ad\
    --h5ad_species mouse\
    --cov_file ${cov_file}.cov\
    --gs_file ${gs_file}.gs\
    --gs_species human\
    --flag_filter True\
    --flag_raw_count True\
    --n_ctrl 1000\
    --flag_return_ctrl_raw_score False\
    --flag_return_ctrl_norm_score True\
--out_folder ${out_dir}--h5ad_file(.h5ad file) : scRNA-seq data--h5ad_species("hsapiens"/"human"/"mmusculus"/"mouse") : species of the scRNA-seq data samples--cov_file(.cov file) : covariate file (optional, .tsv file, see file format)--gs_file(.gs file) : gene set file (see file format)--gs_species("hsapiens"/"human"/"mmusculus"/"mouse") : species for genes in the gene set file--flag_filter("True"/"False") : if to perform minimum filtering of cells and genes--flag_raw_count("True"/"False") : if to perform normalization (size-factor + log1p)--n_ctrl(int) : number of control gene sets (default 1,000)--flag_return_ctrl_raw_score("True"/"False") : if to return raw control scores--flag_return_ctrl_norm_score("True"/"False") : if to return normalized control scores--out_folder: output folder. Score files will be saved as{out_folder}/{trait}.score.gz(see file format)
Input: scRNA-seq data (.h5ad file), gene set file (.gs file), and scDRS full score files (.full_score.gz files)
Output: {trait}.scdrs_ct.{cell_type} file (same as the new {trait}.scdrs_group.{cell_type} file) for cell type-level analyses (association and heterogeneity); {trait}.scdrs_var file (same as the new {trait}.scdrs_cell_corr file) for cell variable-disease association; {trait}.scdrs_gene file for disease gene prioritization.
h5ad_file=your_scrnaseq_data
out_dir=your_output_folder
python compute_downstream.py \
    --h5ad_file ${h5ad_file}.h5ad \
    --score_file @.full_score.gz \
    --cell_type cell_type \
    --cell_variable causal_variable,non_causal_variable,covariate\
    --flag_gene True\
    --flag_filter False\
    --flag_raw_count False\ # flag_raw_count is set to `False` because the toy data is already log-normalized, set to `True` if your data is not log-normalized
--out_folder ${out_dir}--h5ad_file(.h5ad file) : scRNA-seq data--score_file(.full_score.gz files) : scDRS full score files; supporting use of "@" to match strings--cell_type(str) : cell type column (supporting multiple columns separated by comma); must be present inadata.obs.columns; used for cell type-disease association analyses (5% quantile as test statistic) and detecting association heterogeneity within cell type (Geary's C as test statistic)--cell_variable(str) : cell-level variable columns (supporting multiple columns separated by comma); must be present inadata.obs.columns; used for cell variable-disease association analyses (Pearson's correlation as test statistic)--flag_gene("True"/"False") : if to correlate scDRS disease scores with gene expression--flag_filter("True"/"False") : if to perform minimum filtering of cells and genes--flag_raw_count("True"/"False") : if to perform normalization (size-factor + log1p)--out_folder: output folder. Score files will be saved as{out_folder}/{trait}.scdrs_ct.{cell_type}for cell type-level analyses (association and heterogeneity);{out_folder}/{trait}.scdrs_varfile for cell variable-disease association;{out_folder}/{trait}.scdrs_var.{trait}.scdrs_genefile for disease gene prioritization. (see file format)