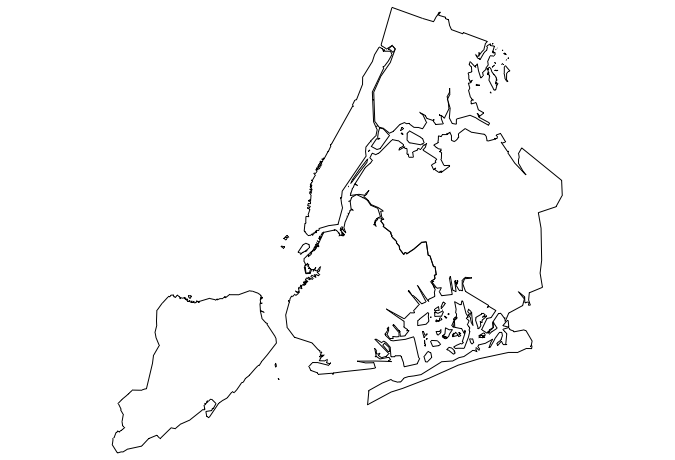
This package provides New York City map data for use with the maps package.
devtools::install_github("zachcp/nycmaps")
libary(nycmaps)
library(maps)
map(database="nyc")
#this should also work with ggplot and ggalt
nyc <- map_data("nyc")
gg  <- ggplot()
gg  <- gg +
         geom_map(
           data=nyc,
           map=nyc,
           aes(x=long, y=lat, map_id=region))
gg
# the followng helper funciton is equivalen to the above
plot_nyc()
nypdcrime <- read.csv("~/Downloads/NYPD_7_Major_Felony_Incidents.csv")
nypdcrime$Location <- nypdcrime$Location.1 nypdcrime$Location <- gsub("\(","", nypdcrime$Location) nypdcrime$Location <- gsub("\)","", nypdcrime$Location) nypdcrime$Latitude <- as.numeric(lapply(nypdcrime$Location, function(x){str_split(x,",")[[1]][[1]]})) nypdcrime$Longitude <- as.numeric(lapply(nypdcrime$Location, function(x){str_split(x,",")[[1]][[2]]}))
gg <- plot_nyc() gg + geom_point(data=nypdcrime, aes(x=Longitude, y=Latitude))
ny2015 <- nypdcrime[nypdcrime$Occurrence.Year >= 2015,] gg <- ggplot(ny2015) + geom_point(data=ny2015, aes(x=Longitude, y=Latitude, color=Offense)) + facet_grid(Occurrence.Month~Offense) gg
gg <- plot_nyc() gg <- gg +geom_point(data=ny2015[ny2015$Offense == "MURDER",], aes(x=Longitude, y=Latitude, color=Occurrence.Month)) + facet_wrap(~Occurrence.Month) gg
