In this project, a convolutional neural networks is used to classify traffic signs. The model is trained and validated on German Traffic Sign Dataset.
For more details on the training the model, results, and requirements check project writeup.
- Download the German Traffic Sign Dataset from here
- Create a
./data/folder next to the Jupyter notebook, unzip the downloaded dataset file and put the.pfiles in the./data/folder.
Summary of Dataset
Number of training examples = 34799
Number of validation examples = 4410
Number of testing examples = 12630
Image data shape = (32, 32, 3)
Number of classes = 43
- Dataset is sequential (all images of a class are after each other)
- Images are 32x32x3 RGB, with dtype=np.uint8.
- Images are cropped to the traffic sign. No environment.
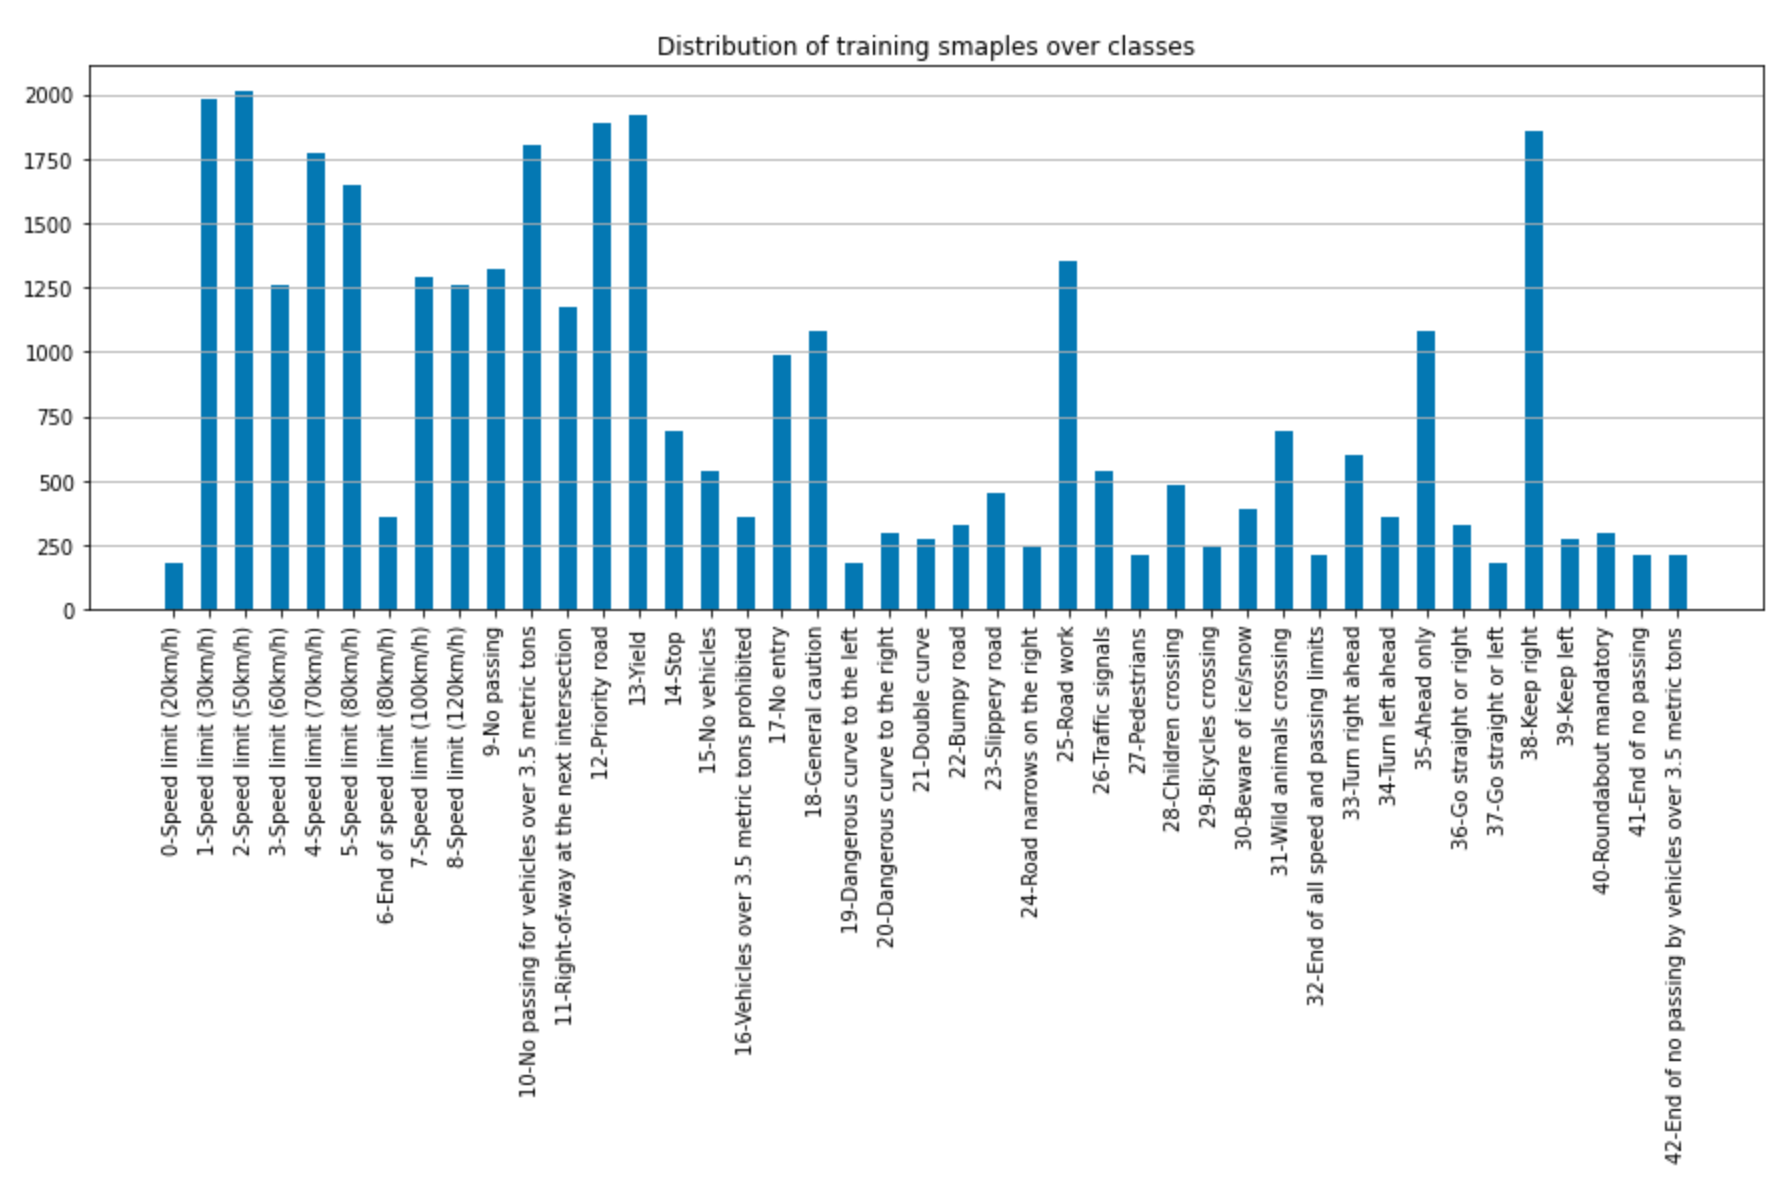
- The distribution of the training data is not uniform. With as few as about 180 images for classes like "0-Speed Limit (20 km/h)" or "19-Dangerous curve to the left", to around 2000 or more for classes like "3-Speed Limit (50 km/h)" or ""2-Speed Limit (30 km/h).
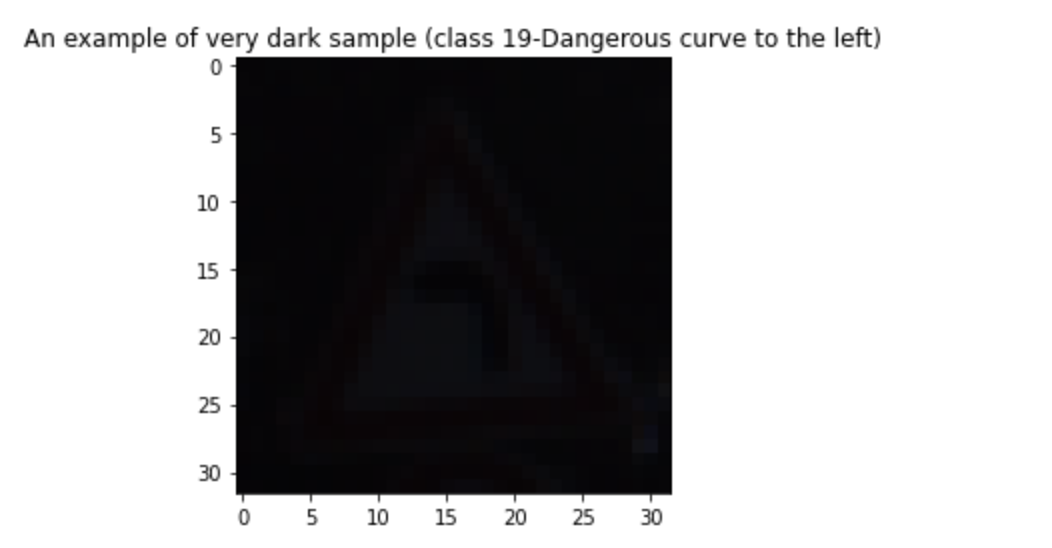
- Quality of some images are not good. For example the first 25 images for the class "19-Dangerous curve to the left" are almost black, with nothing recognizable with human eyes.
There are 43 classes of German Traffic Signs. The dataset is not uniformly distributed over classes. For some classes there are more than 2000 sampels, whereas for some classes there are less than 200 samples. Follwing figure shows the distribution of samples over classes.
Also the quality of sample images differs a lot. Some images have very good lighting, are clear and sharp, and occlusion free. Some samples are very dark, are partially occluded, have noise (like stickers attached on the sign). The following figure is an example of a very dark sample, that is practically unrecognizable for human eye:
Sinsce color is an important feature of traffic signs (the red ones signify dangers or prohibitions, the blue ones signify information) I decided to keep the RGB images for training and do not convert them to gray scale.
My preprocessing only consists of normalizing the images to zero mean using the following formula: (pixel - 128)/ 128. This turns each color channel of the image into a float32 array with values between -1 and 1.
I also shuffled the training set before training.
I started with LeNet and adapted it for RGB images and number of calsses in the traffic sign database.
| Layer | Description |
|---|---|
| Input | 32x32x3 RGB image |
| Convolution 5x5x3x6 | 1x1 stride, valid padding, outputs 28x28x6 |
| RELU | |
| Max pooling 3x3 | 2x2 stride, same paddding, outputs 14x14x6 |
| Convolution 5x5x6x16 | 1x1 strid, valid padding, outputs 10x10x16 |
| RELU | |
| Max pooling 3x3 | 2x2 stride, same padding, outputs 5x5x16 |
| Fully connected | input 400, output 120 |
| Fully connected | input 120, output 84 |
| Softmax (Output) | input 84, output 43 |
Since I got the good results (96% accuracy on test set; project requirement was at least 93% accuracy on test set) I kept the architecture.
I started with batch size 128, and 100 epochs. I then observed that after epoch 50 the validation set accuracy oscilates and does not imprve. So I reduced the epochs to 50. I then added dropout to the model, which imprved the validation set accuracy by about 2 percent (from almost 94% to 96%). Adam is used as optimizer for training the model. I started the training with learning rate 0.001. I wanted to apply learning rate decay, however read here that learning rate decay is not very effective for Adam since it adaptively associates an individual learning rated to every parameter in the model. The initial input learning rate is used as upper limit. Instead of reducing the leraning rate, I doubled the batch size after epoch 25, which should have an equivalent effect as described here
The classifier achieved 96% accuracy on test set.
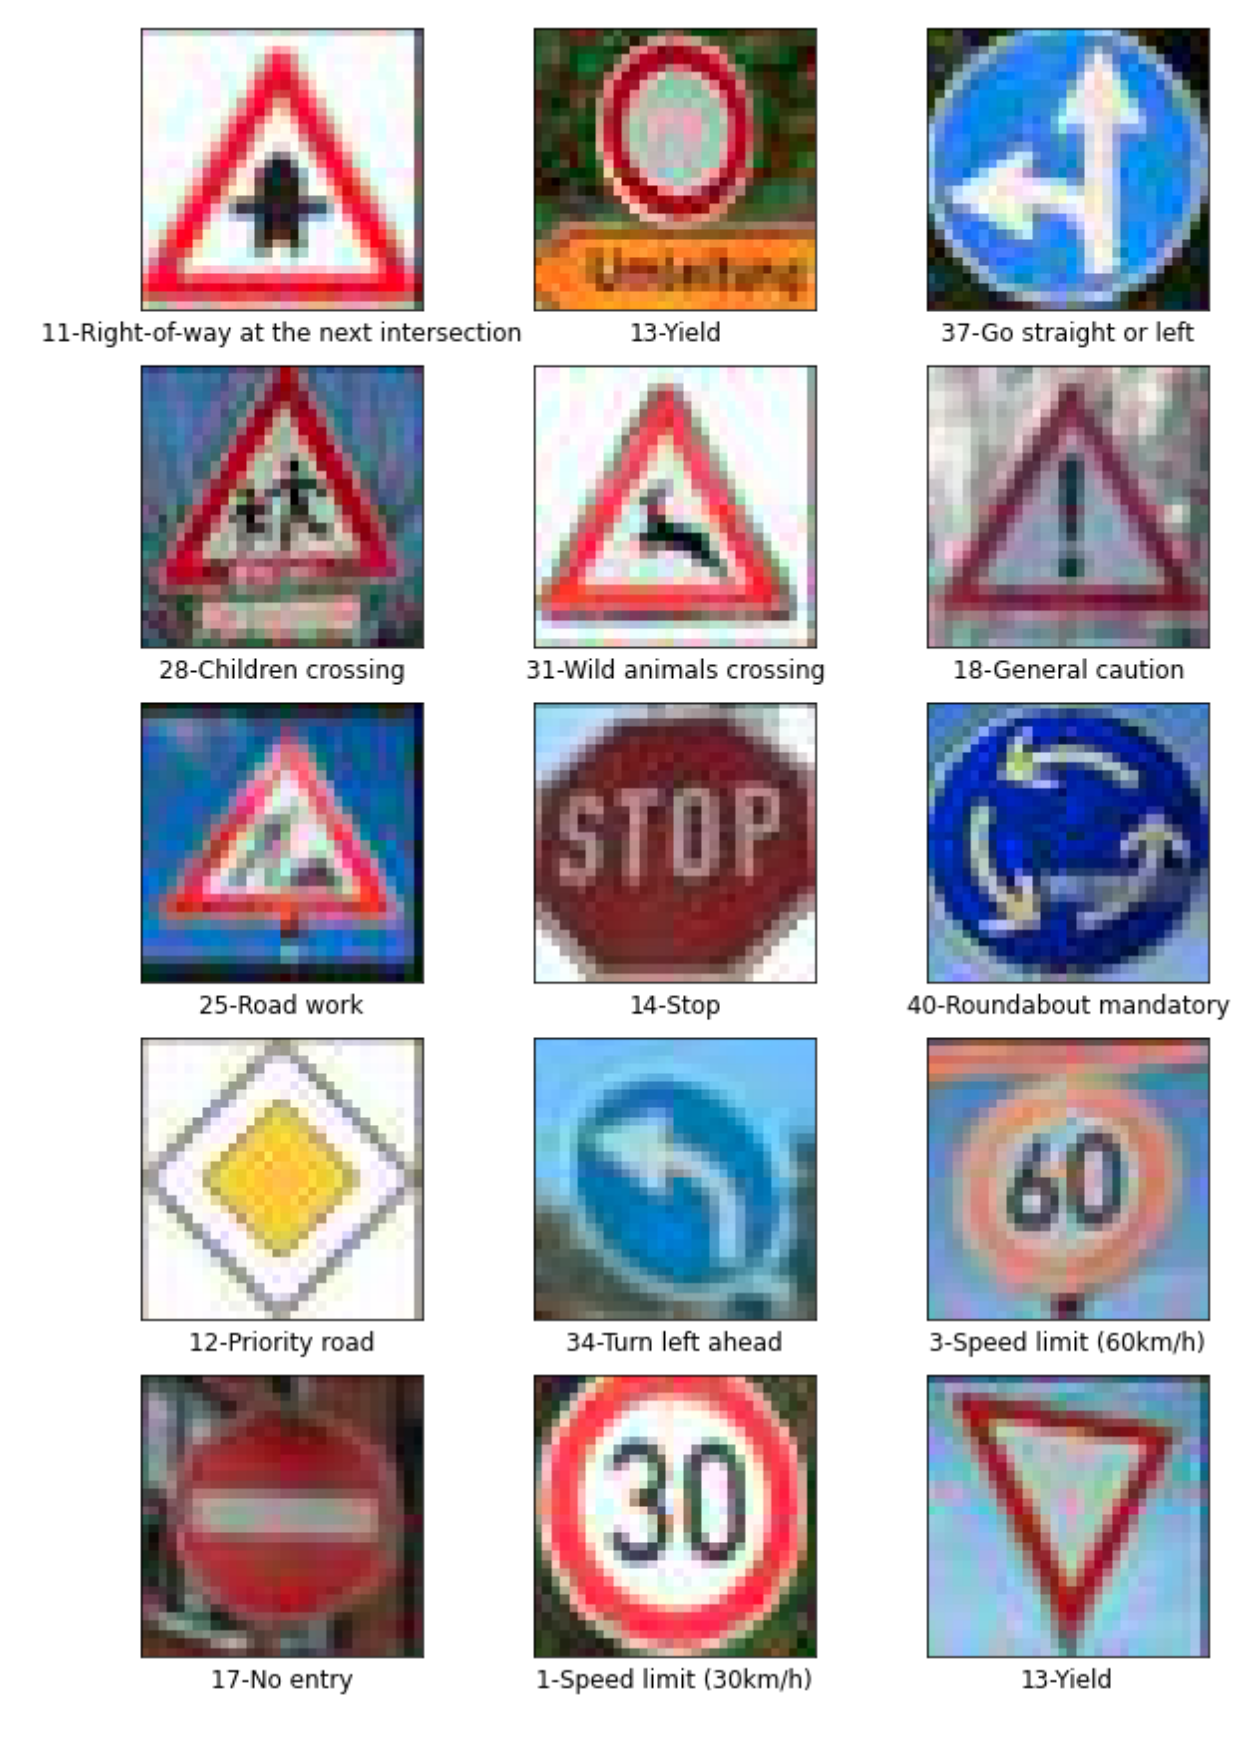
I also manually tested the classifier on the following images of German traffic signs (downloaded from the Internet):
As can be seen the second image on the top row (No Vehicle sign) is misclassified as Yield sign.
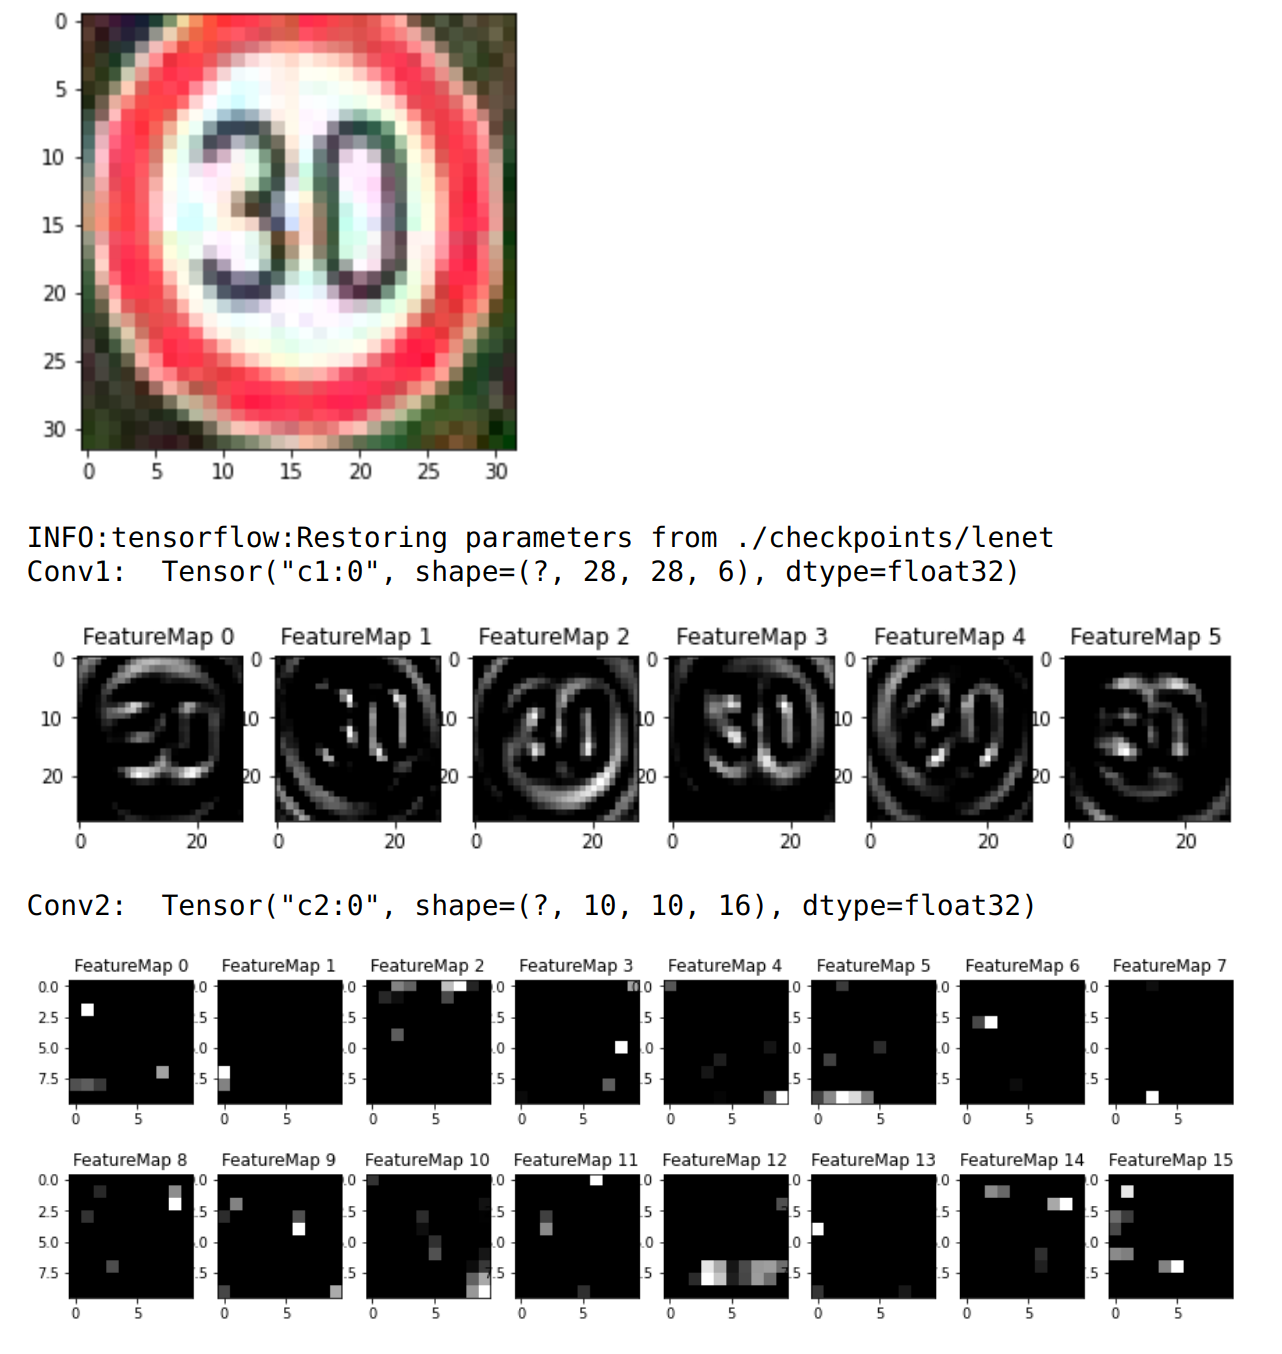
Figure below shows the network activations for the input image Speed Limit (30 km/h). As can be seen, right the first convolutional layer of the network reacts to round and high contrast patterns in the input image.


