PEGS (Peak-set Enrichment of Gene-Sets) is
a Python bioinformatics utility for calculating enrichments of gene
clusters at different genomic distances from peaks.
- Free software: 3-Clause BSD License
- Documentation: https://pegs.readthedocs.io/en/latest/
- Code: https://github.com/fls-bioinformatics-core/pegs
It is recommended to install PEGS via pip in a virtualenv,
for example:
% virtualenv venv.pegs
% source venv.pegs/bin/activate
% pip install pegs
This will provide the pegs and mk_pegs_intervals programs.
Alternatively you can install PEGS into a Conda environment,
for example:
% conda create -c bioconda -c conda-forge -n pegs pegs
The simplest use of PEGS is:
pegs GENE_INTERVALS --peaks PEAKS1 [PEAKS2 ...] --genes CLUSTERS1 [CLUSTERS2 ...]
where GENE_INTERVALS is a set of reference transcription
start sites (TSSs) for all genes, PEAKS1...N are one or more
BED files with peak-sets, and CLUSTERS1...N are one or more
files defining gene clusters.
This will output a PNG heatmap and an XLXS file with the p-values and gene counts from the enrichment calculations.
Full documentation can be found at:
PEGS is licensed under the 3-Clause BSD License.
Thanks to Louise Hunter for providing this example.
An example application of PEGS is the analysis of up- and
down-regulated glucocorticoidal targets from an RNA-seq study
of liver samples from mice treated acutely with dexamethasone
or vehicle (Caratti et al. 2018), combined with corresponding
GR ChIP-seq and chromatin accessibility data (DNase I
hypersensitive (DHS) regions) (Grontved et al. 2013 and
Sobel et al. 2017 respectively), and mouse liver TAD
boundary data (Kim et al. 2018).
The files for these datasets are available here:
- RNA-seq data: 1_zt6up.txt and 2_zt6down.txt
- ChIP-seq and chromatin accessibility data: Grontved_GR_ChIP.bed and ZT6_DNase.bed
- TAD boundary data: mESC-TADs_mm10.txt
The PEGS analysis was performed on these data using the
command:
pegs mm10 \
  --peaks data/peaks/*.bed --genes data/clusters/*.txt \
  -t data/mESC-TADs_mm10.txt \
  -d 1000 5000 10000 50000 100000 200000 500000 1000000 5000000
The resulting output files (XLSX and heatmap) can be found here:
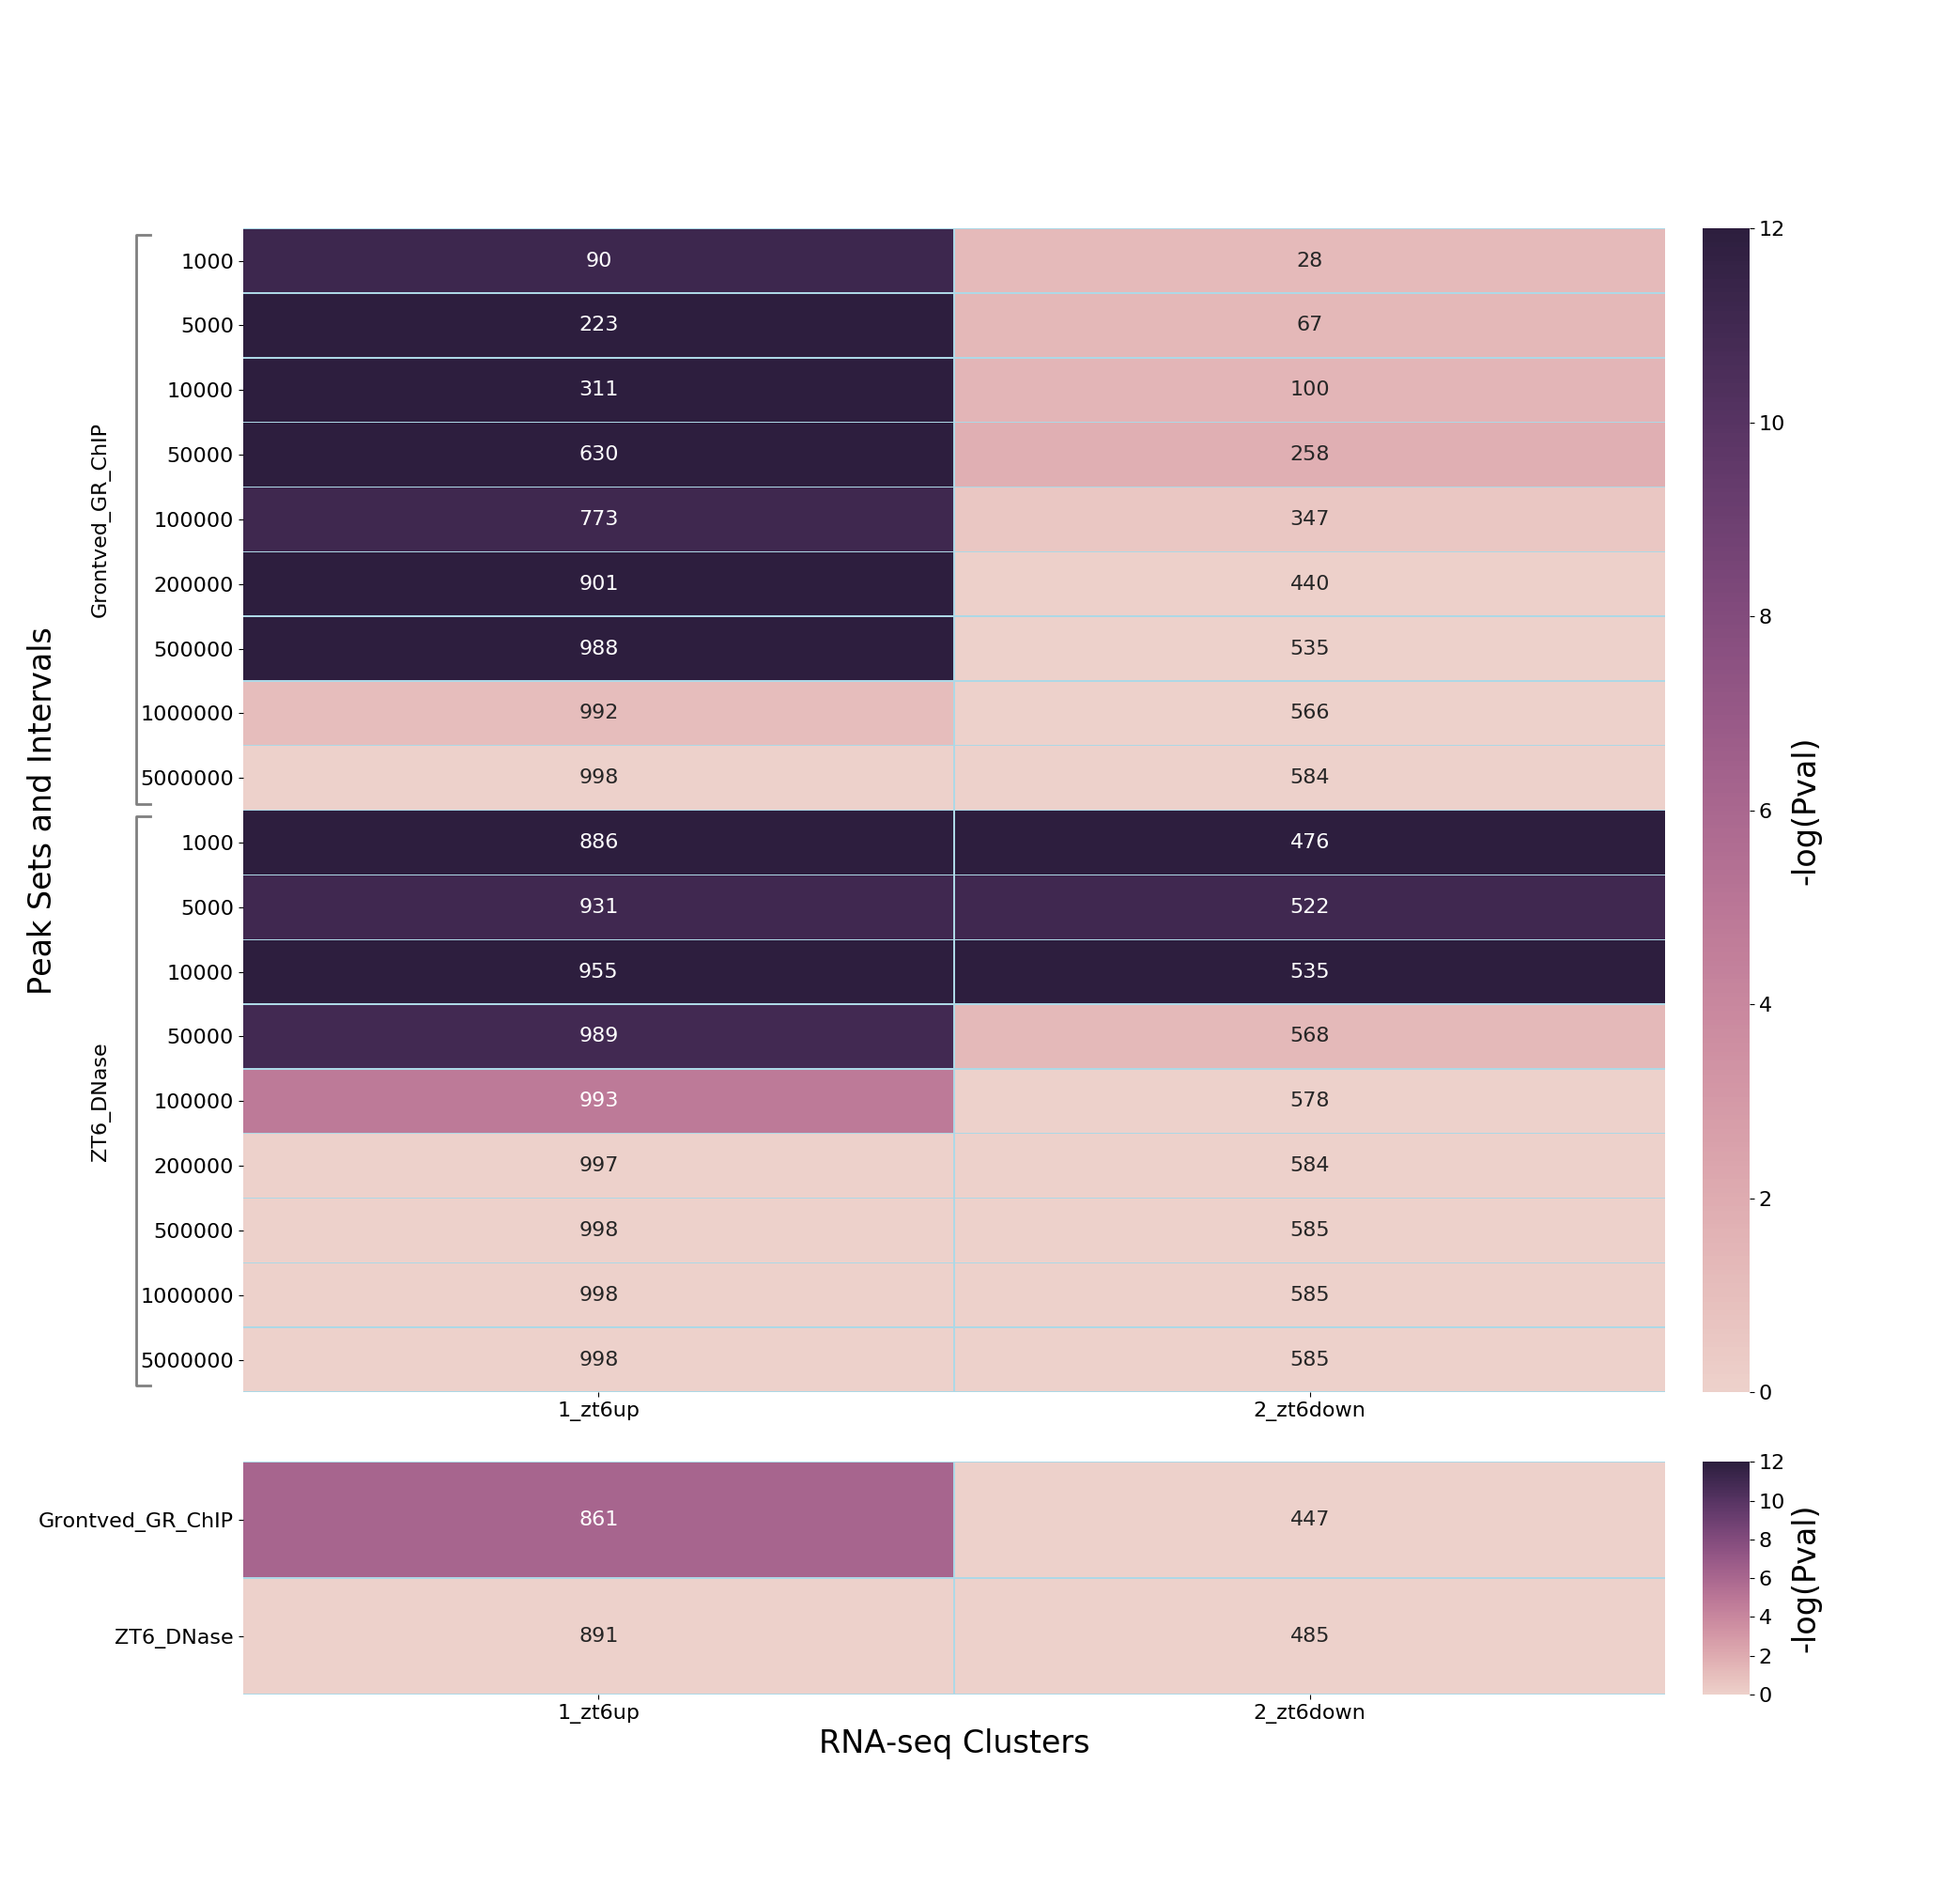
The analyses indicate a strong association of dexamethasone up-regulated genes with dexamethasone-induced GR peaks at distances up to 500kbp from these peaks, but no evidence of down-regulated genes - indicating distinct mechanisms of gene activation and repression by glucocorticoids. At the same time, there is promoter proximal enrichment for both up-and
References
- Caratti, G. et al. (2018) REVERBa couples the clock to hepatic glucocorticoid action. J Clin Invest 128(10):4454-4471
- Grontved, L. et al. (2013) C/EBP maintains chromatin accessibility in liver and facilitates glucocorticoid receptor recruitment to steroid response elements. EMBO J 32(11), 1568-83
- Kim, Y.H. et al. (2018) Rev-erbα dynamically modulates chromatin looping to control circadian gene transcription. Science 359(6381):1274-1277
- Sobel, J.A. et al. (2017) Transcriptional regulatory logic of the diurnal cycle in the mouse liver. PLoS Biol 15(4): e2001069
Thanks to Louise Hunter for providing the mouse glucocorticoidal
example, and to Kyle Pollina for allowing us to use the pegs
name on the Python Package Index.