It's easiest to install HiTMapper with the help of the devtools package.
install.packages("devtools") # if necessary
devtools::install_github("matei-ionita/HiTMapper")
Mapper is an algorithm developed for topological data analysis, originally due to [1]. It constructs a graph which approximates the (hypothetical) landscape from which data points are sampled. HiTMapper is an implementation which is tailored to cytometry data: for example, only using subroutines that run in linear time, so that millions of data points can be processed in a few minutes.
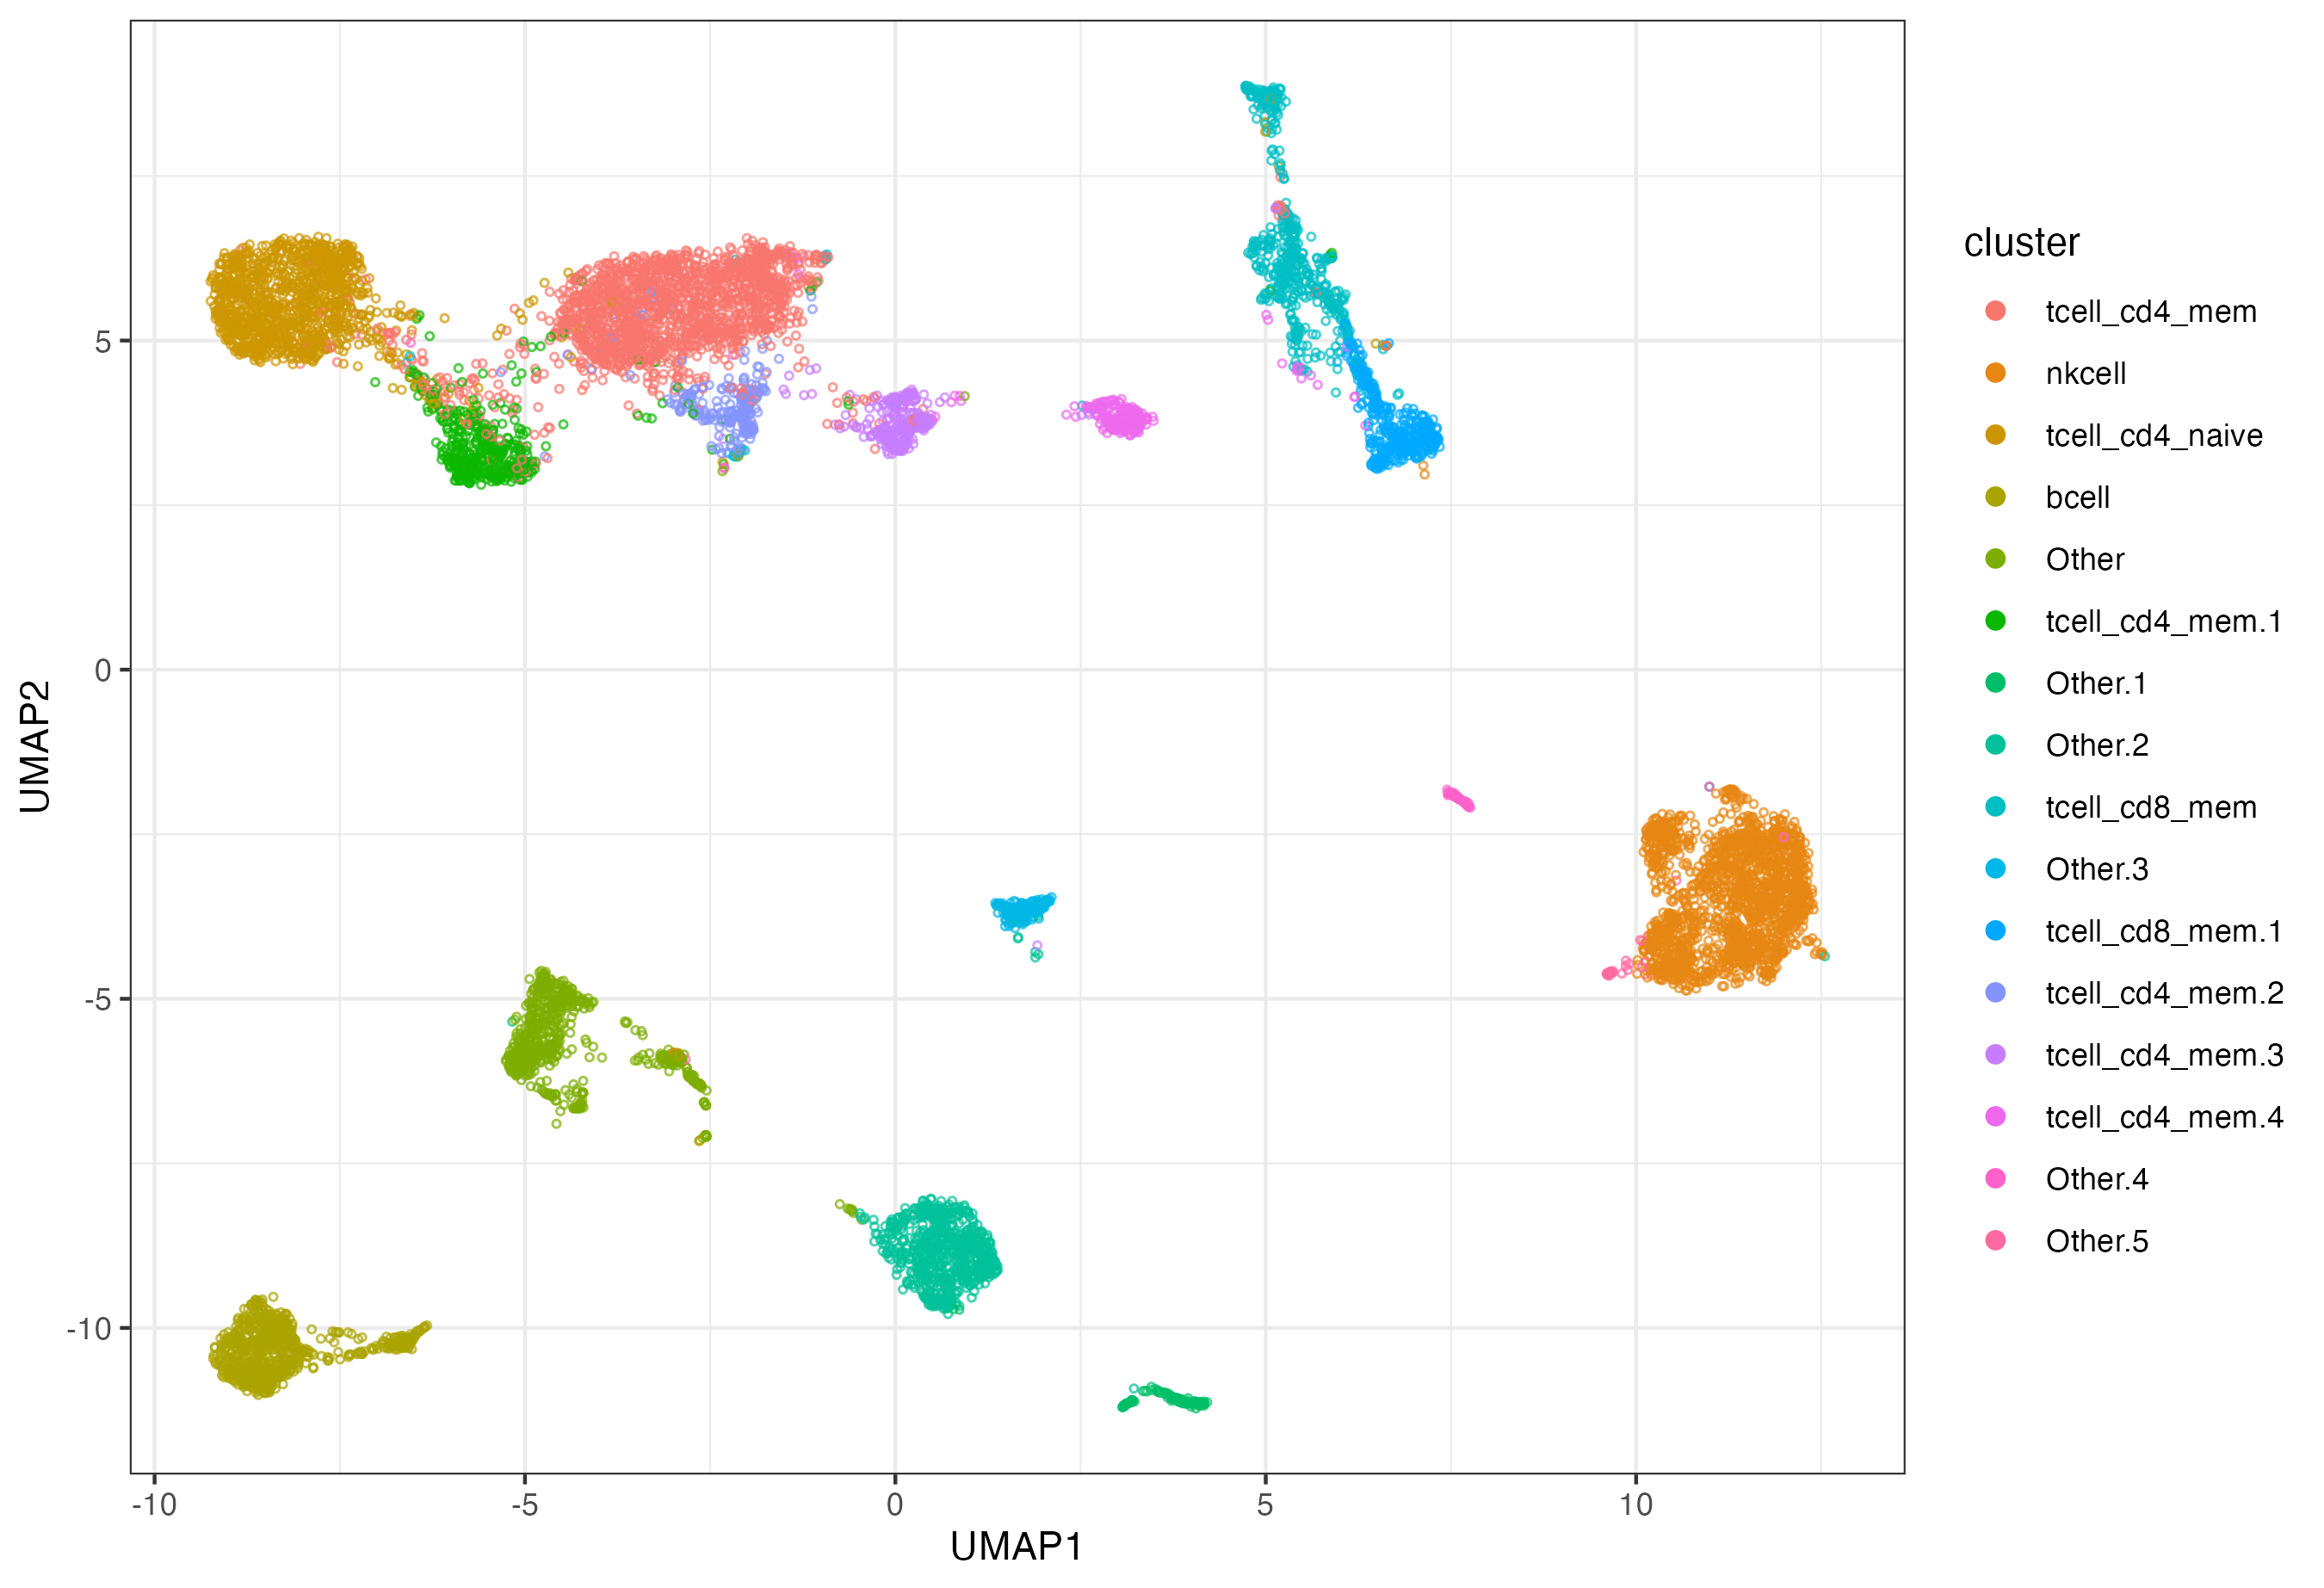
Each node in the Mapper graph represents multiple data points, resulting in a compact visualization of the dataset. Crucially, the nodes are fine-grained, not meant to represent distinct phenotypes, but rather subtly different cell states. This enables the visualization of hundreds of detailed cell states in a relational framework. We can also use the graph to provide a warm start for traditional clustering, using the Leiden method[2] for community detection.
[1] Singh, Gurjeet, Facundo Mémoli, and Gunnar E. Carlsson. "Topological methods for the analysis of high dimensional data sets and 3d object recognition." SPBG 91 (2007): 100.
[2] Traag, Vincent A., Ludo Waltman, and Nees Jan Van Eck. "From Louvain to Leiden: guaranteeing well-connected communities." Scientific reports 9.1 (2019): 1-12.
