climateR simplifies the steps needed to get climate data into R. At
its core it provides three main things:
- A catalog of over 100,000k datasets from over 2,000 data
providers/archives. See (
climateR::params)
nrow(params)
#> [1] 107857
length(unique(params$id))
#> [1] 2075
length(unique(params$asset))
#> [1] 4653
This catalog is an evolving, federated collection of datasets that can be accessed by the data access utilities.
-
A general toolkit for accessing remote and local gridded data files bounded by space, time, and variable constraints (
dap,dap_crop,read_dap_file) -
A set of shortcuts that implement these methods for a core set of selected catalog elements
⚠️ Python Users: Data catalog access is available through the USGSgdptoolspackage. Directly analogous climateR functionality can be found inclimatePy
remotes::install_github("mikejohnson51/AOI") # suggested!
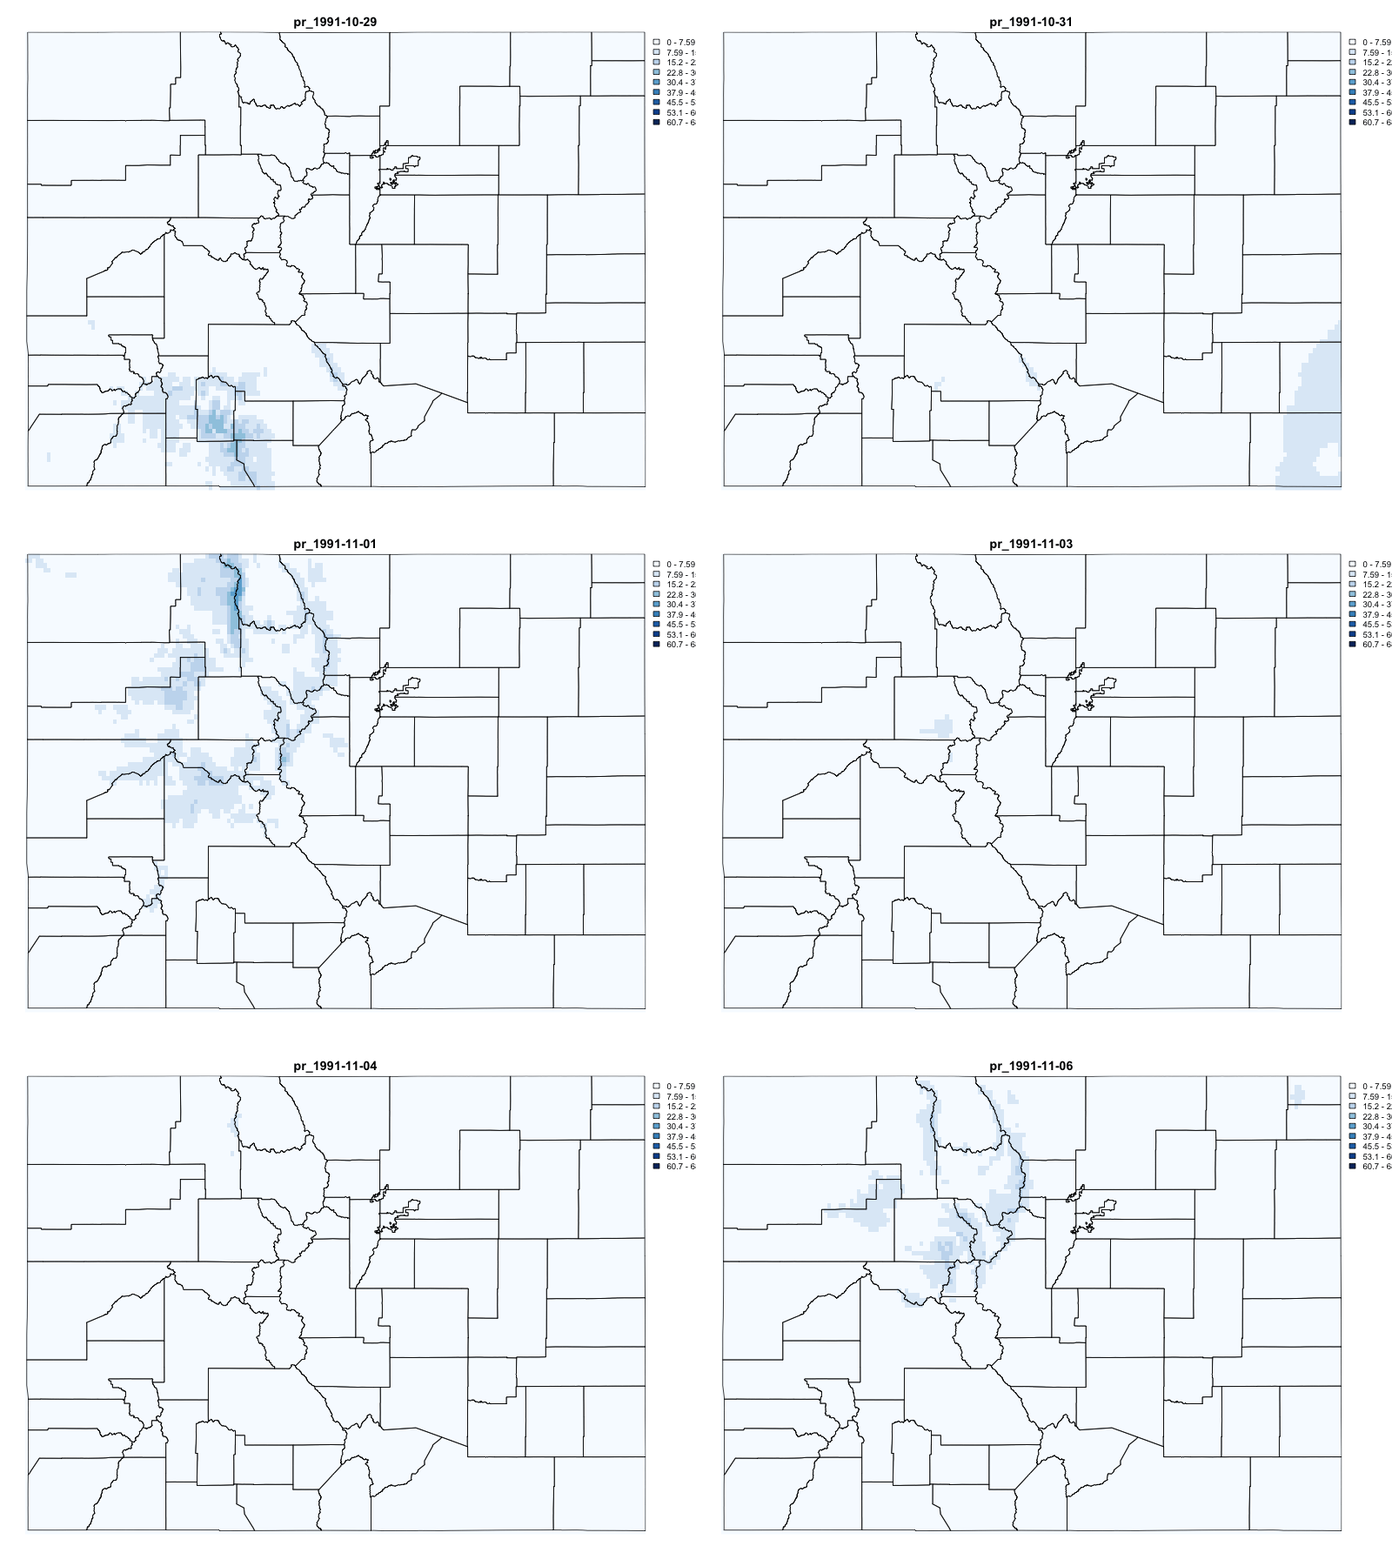
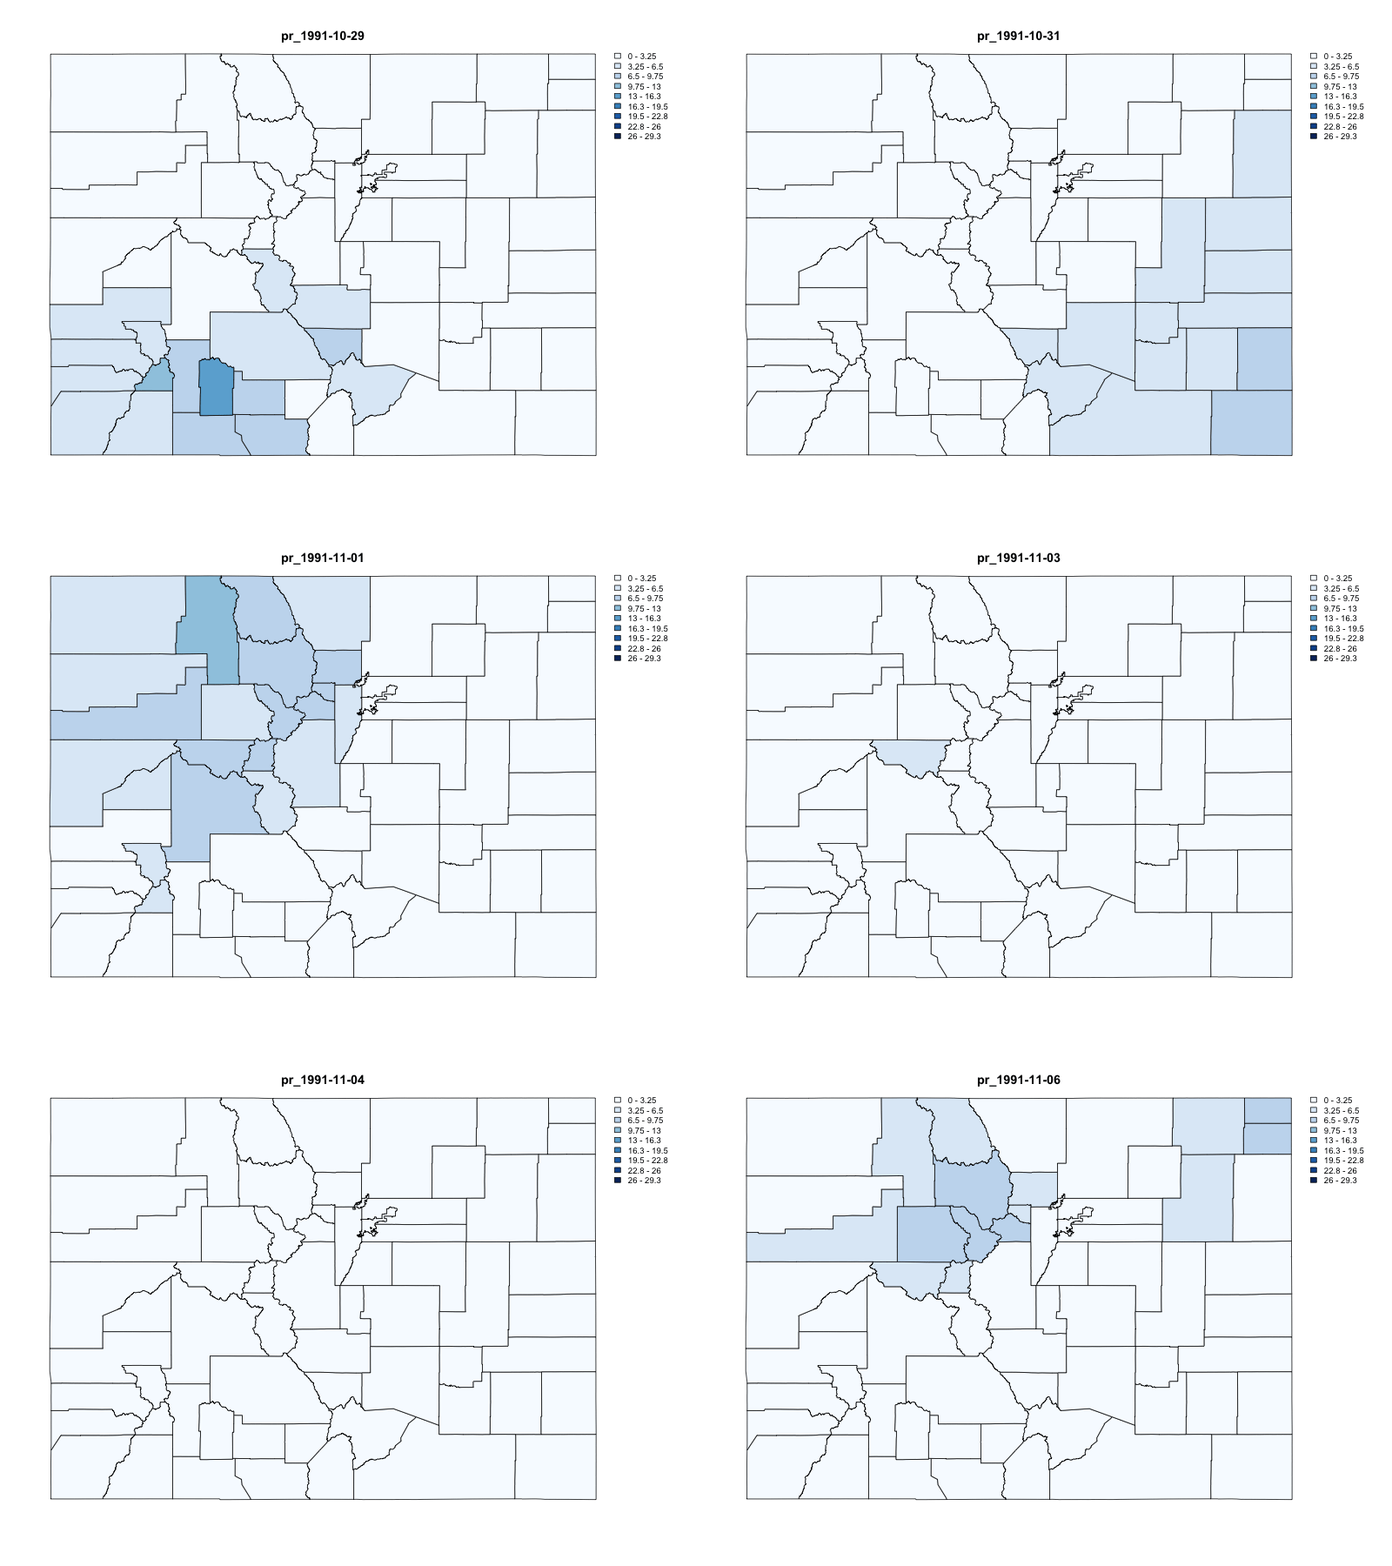
remotes::install_github("mikejohnson51/climateR")Finding rainfall in Colorado between October 29,1991 - November 6, 1991. The source dataset for this example uses the getGridMET shortcut.
library(AOI)
library(terra)
library(climateR)

AOI = aoi_get(state = "CO", county = "all")
system.time({
d = getGridMET(AOI,
varname = "pr",
startDate = "1991-10-29",
endDate = "1991-11-06")
})
#> user system elapsed
#> 0.245 0.054 0.982animation(d$precipitation_amount, AOI = AOI, outfile = "man/figures/rast_gif.gif")library(zonal)
system.time({
county = execute_zonal(d, geom = AOI, ID = "fip_code")
})
#> user system elapsed
#> 0.328 0.018 0.366animation(county, feild_pattern = "pr_", outfile = "man/figures/vect_gif.gif")


