There is a major methodological update for multiple-testing corrections.
Please read misc/multiple-testing.md. You should read our citation below for more details.
See workflow/scan-case-control if you are here for IBD mapping, not selection.
See misc/usage.md to evaluate if this methodology fits your study.
See misc/cluster-options.md for some suggested cluster options to use in pipelines.
See on GitHub "Issues/Closed" for some comments about the pipeline.
Contact sethtem@umich.edu or Github issues for troubleshooting.
Please cite if you use this package.
Temple, S.D., Waples, R.K., Browning, S.R. (2024). Modeling recent positive selection using identity-by-descent segments. The American Journal of Human Genetics. https://doi.org/10.1016/j.ajhg.2024.08.023.
Temple, S.D., Thompson, E.A. (2024). Identity-by-descent in large samples. Preprint at bioRxiv, 2024.06.05.597656. https://www.biorxiv.org/content/10.1101/2024.06.05.597656v1.
Temple, S.D., Browning, S.B. (2024). "Multiple testing corrections in selection studies using identity-by-descent segments. Draft in progress.
Temple, S.D., ..., Wijsman, E., and Blue, E. (2024-25). "Multiple testing corrections in case-control studies using identity-by-descent segments." Draft in progress.
Temple, S.D., Browning, S.B., and Thompson, E.A. (2024). "Fast simulation of identity-by-descent segments." Draft in progress.
Temple, S.D. (2024). "Statistical Inference using Identity-by-Descent Segments: Perspectives on Recent Positive Selection." PhD thesis (University of Washington). https://www.proquest.com/docview/3105584569?sourcetype=Dissertations%20&%20Theses.
Acronym: incomplete Selective sweep With Extended haplotypes Estimation Procedure
This software presents methods to study recent, strong positive selection.
- By recent, we mean within the last 500 generations.
- By strong, we mean selection coefficient s >= 0.015 (1.5%).
- Scan may have moderate power for s >= 0.01 (1%).
In modeling a sweep, we assume 1 selected allele at a locus.
- A genome-wide selection scan for anomalously large IBD rates
- With multiple testing correction
- Inferring anomalously large IBD clusters
- Ranking alleles based on evidence for selection
- Computing a measure of cluster agglomeration (Gini impurity index)
- Estimating frequency and location of unknown sweeping allele
- Estimating a selection coefficient
- Estimating a confidence interval
Step 1 may be standalone, depending on the analysis. (You may not care to model putative sweeps (Steps 2-7).)
See misc/usage.md.
- Whole genome sequences
- Probably at least > 500 diploids
- Phased vcf data 0|1
- No apparent population structure
- No apparent close relatedness
- Tab-separated genetic map (bp ---> cM)
- Without headers!
- Columns are chromosome, rsID, cM, bp
- Recombining diploid autosomes
- For haploids, see issue 5 "Not designed for ploidy != 2"
- Access to cluster computing
- Not extended to cloud computing
Chromosome numbers in genetic maps should match chromosome numbers in VCFs.
This repository contains a Python package and some Snakemake bioinformatics pipelines.
- The package --->
src/ - The pipelines --->
workflow/
You should run all snakemake pipelines in their workflow/some-pipeline/.
You should be in the mamba activate isweep environment for analyses.
You should run the analyses using cluster jobs.
See misc/installing-mamba.md to get a Python package manager.
- Clone the repository
git clone https://github.com/sdtemple/isweep.git
- Get the Python package
mamba env create -f isweep-environment.yml
mamba activate isweep
python -c 'import site; print(site.getsitepackages())'
- Download software.
bash get-software.sh
- Requires
wget. - You need to cite these software.
Phase data w/ Beagle or Shapeit beforehand.
Subset data in light of global ancestry and close relatedness.
Example scripts are in scripts/pre-processing/.
- Here is a pipeline we built for these purposes:
https://github.com/sdtemple/flare-pipeline - You could use IBDkin to detect close relatedness:
https://github.com/YingZhou001/IBDkin - You could use PCA, ADMIXTURE, or FLARE to determine global ancestry.
You will see more details for each step in workflow/some-pipeline/README.md files.
- Make pointers to large (phased) vcf files.
- Edit YAML files in the different workflow directories.
Run the selection scan (workflow/scan-selection).
nohup snakemake -s Snakefile-scan.smk -c1 --cluster "[options]" --jobs X --configfile *.yaml &
- See the file
misc/cluster-options.mdfor support. - Recommendation: do a test run with your 2 smallest chromosomes.
- Check
*.logfiles fromibd-ends. If it recommends an estimated err, change error rate in YAML file. - Then, run with all your chromosomes.
Make the IBD rates plot customized if you want: workflow/scan-selection/scripts/plotting/plot-scan.py.
Outputs:
scan.modified.ibd.tsvshould have all the data for the scanning statistics and thresholds.- 'Z' variables are standardized/normalized.
- 'RAW' are counts.
- p values assume that IBD rates are (asymptotically) normally distributed.
roi.tsvare your significant regions.autocovariance.pngis autocovariance by cM distance. The black line is a fitted exponential curve.zhistogram.pngis a default histogram for the IBD rates standardized. It should "look Gaussian".scan.pngis a default plot for the selection scan.fwer.analytical.txtgives parameters and estimates for multiple-testing selection scan.
- Estimate recent effective sizes :
workflow/scan-selection/scripts/run-ibdne.sh. - Checkout the
roi.tsvfile.
- Edit with locus names if you want.
- Edit to change defaults: additive model and 95% confidence intervals.
- Run the region of interest analysis (
workflow/model-selection).
nohup snakemake -s Snakefile-roi.smk -c1 --cluster "[options]" --jobs X --configfile *.yaml &
The script to estimate recent Ne can be replaced with any method to estimate recent Ne, as it happens before the snakemake command. This method HapNe is one such option.
Outputs:
summary.hap.norm.tsvare estimated selection coefficients, and other estimates, for regions of interest.- Read Temple, Waples, and Browning (AJHG, 2024) to learn about the estimates.
- Confidence intervals assume IBD rates are (asymptotically) normally distributed.
- Frequency estimate is based on the best differentiated SNP subset.
- Models are 'a' additive, 'm' multiplicative, 'd' dominance, and 'r' recessive.
- Other types of confidence intervals.
- 'perc' wildcard means percentile-based confidence intervals.
- 'snp' wildcard means that frequency estimate is based on best differentiated SNP.
These Markdown files are in the folder misc/.
See telomeres-centromeres.md for cautionary comments on interpreting results near these genomic regions.
See small-chromosomes.md for comments on modified analyses when some chromosomes measure <= 10 cM.
See different-chromosome-rates.md for comments on modified analyses when chromosome subsets have vastly different mean/median IBD rates.
For species-specific conversions very different from 1.0 cM recombination-rates.md
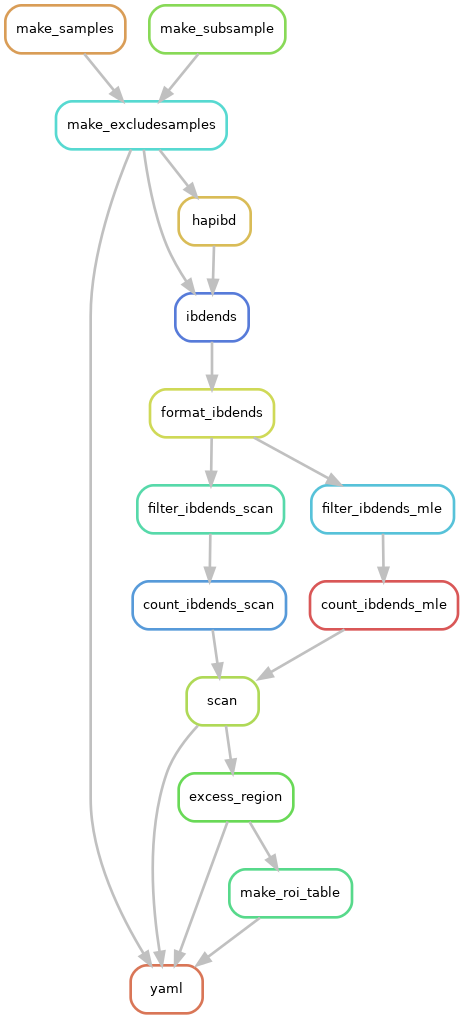
The flow chart below shows the steps ("rules") in the selection scan pipeline.
Diverting paths "mle" versus "scan" refer to different detection thresholds (3.0 and 2.0 cM).
See dag-roi.png for the steps in the sweep modeling pipeline.
