This repository will not be updated. The repository will be kept available in read-only mode.
Visualize and analyze data from the 2017 flood in Houston, TX using a Jupyter Notebook on IBM Watson Studio
In this Code Pattern we will use some standard techniques for data science and data engineering running on IBM Watson Studio to analyze publicly available data for the 2017 flooding in Houston, TX. Watson Studio is an interactive, collaborative, cloud-based environment where data scientists, developers, and others interested in data science can use tools (e.g., RStudio, Jupyter Notebooks, Spark, etc.) to collaborate, share, and gather insight from their data.
When the reader has completed this Code Pattern, they will understand how to:
- Use Jupyter Notebooks to load, visualize, and analyze data
- Run Notebooks in IBM Watson Studio
- Leverage PixieDust as a python notebook helper
- Build a dashboard using PixieApps
- Find, curate, and display publicly available data
- Create an interactive map with Mapbox GL
The intended audience for this Code Pattern is application developers and other stakeholders who wish to utilize the power of Data Science quickly and effectively.
- Load the Jupyter notebook onto the IBM Watson Studio platform.
- USGS data from the Houston flood of 2017 is loaded into the notebook.
- The notebook is used to clean the data, and then display it.
- A PixieApp dashboard is created and can be interacted with.
- Mapbox and Folium are used for map visualizations
- IBM Watson Studio: Analyze data using RStudio, Jupyter, and Python in a configured, collaborative environment that includes IBM value-adds, such as managed Spark.
- Jupyter Notebooks: An open-source web application that allows you to create and share documents that contain live code, equations, visualizations and explanatory text.
- PixieDust Python helper library for python notebooks
- PixieApps: Python library used to write UI elements for analytics, and run them directly in a Jupyter notebook.
- Mapbox GL: JavaScript library that uses WebGL to render interactive maps.
- An account on IBM Cloud to access Watson Studio
- Get a Mapbox Token for use in the notebook
Follow these steps to setup and run this Code Pattern. The steps are described in detail below.
Sign up for IBM's Watson Studio. By creating a project in Watson Studio a free tier Object Storage service will be created in your IBM Cloud account. Take note of your service names as you will need to select them in the following steps.
Note: When creating your Object Storage service, select the
Freestorage type in order to avoid having to pay an upgrade fee.
- In Watson Studio, click
New Project +under Projects or, at the top of the page click+ Newand choose the tile forData Scienceand thenCreate Project. - In Watson Studio using the project you've created, click on
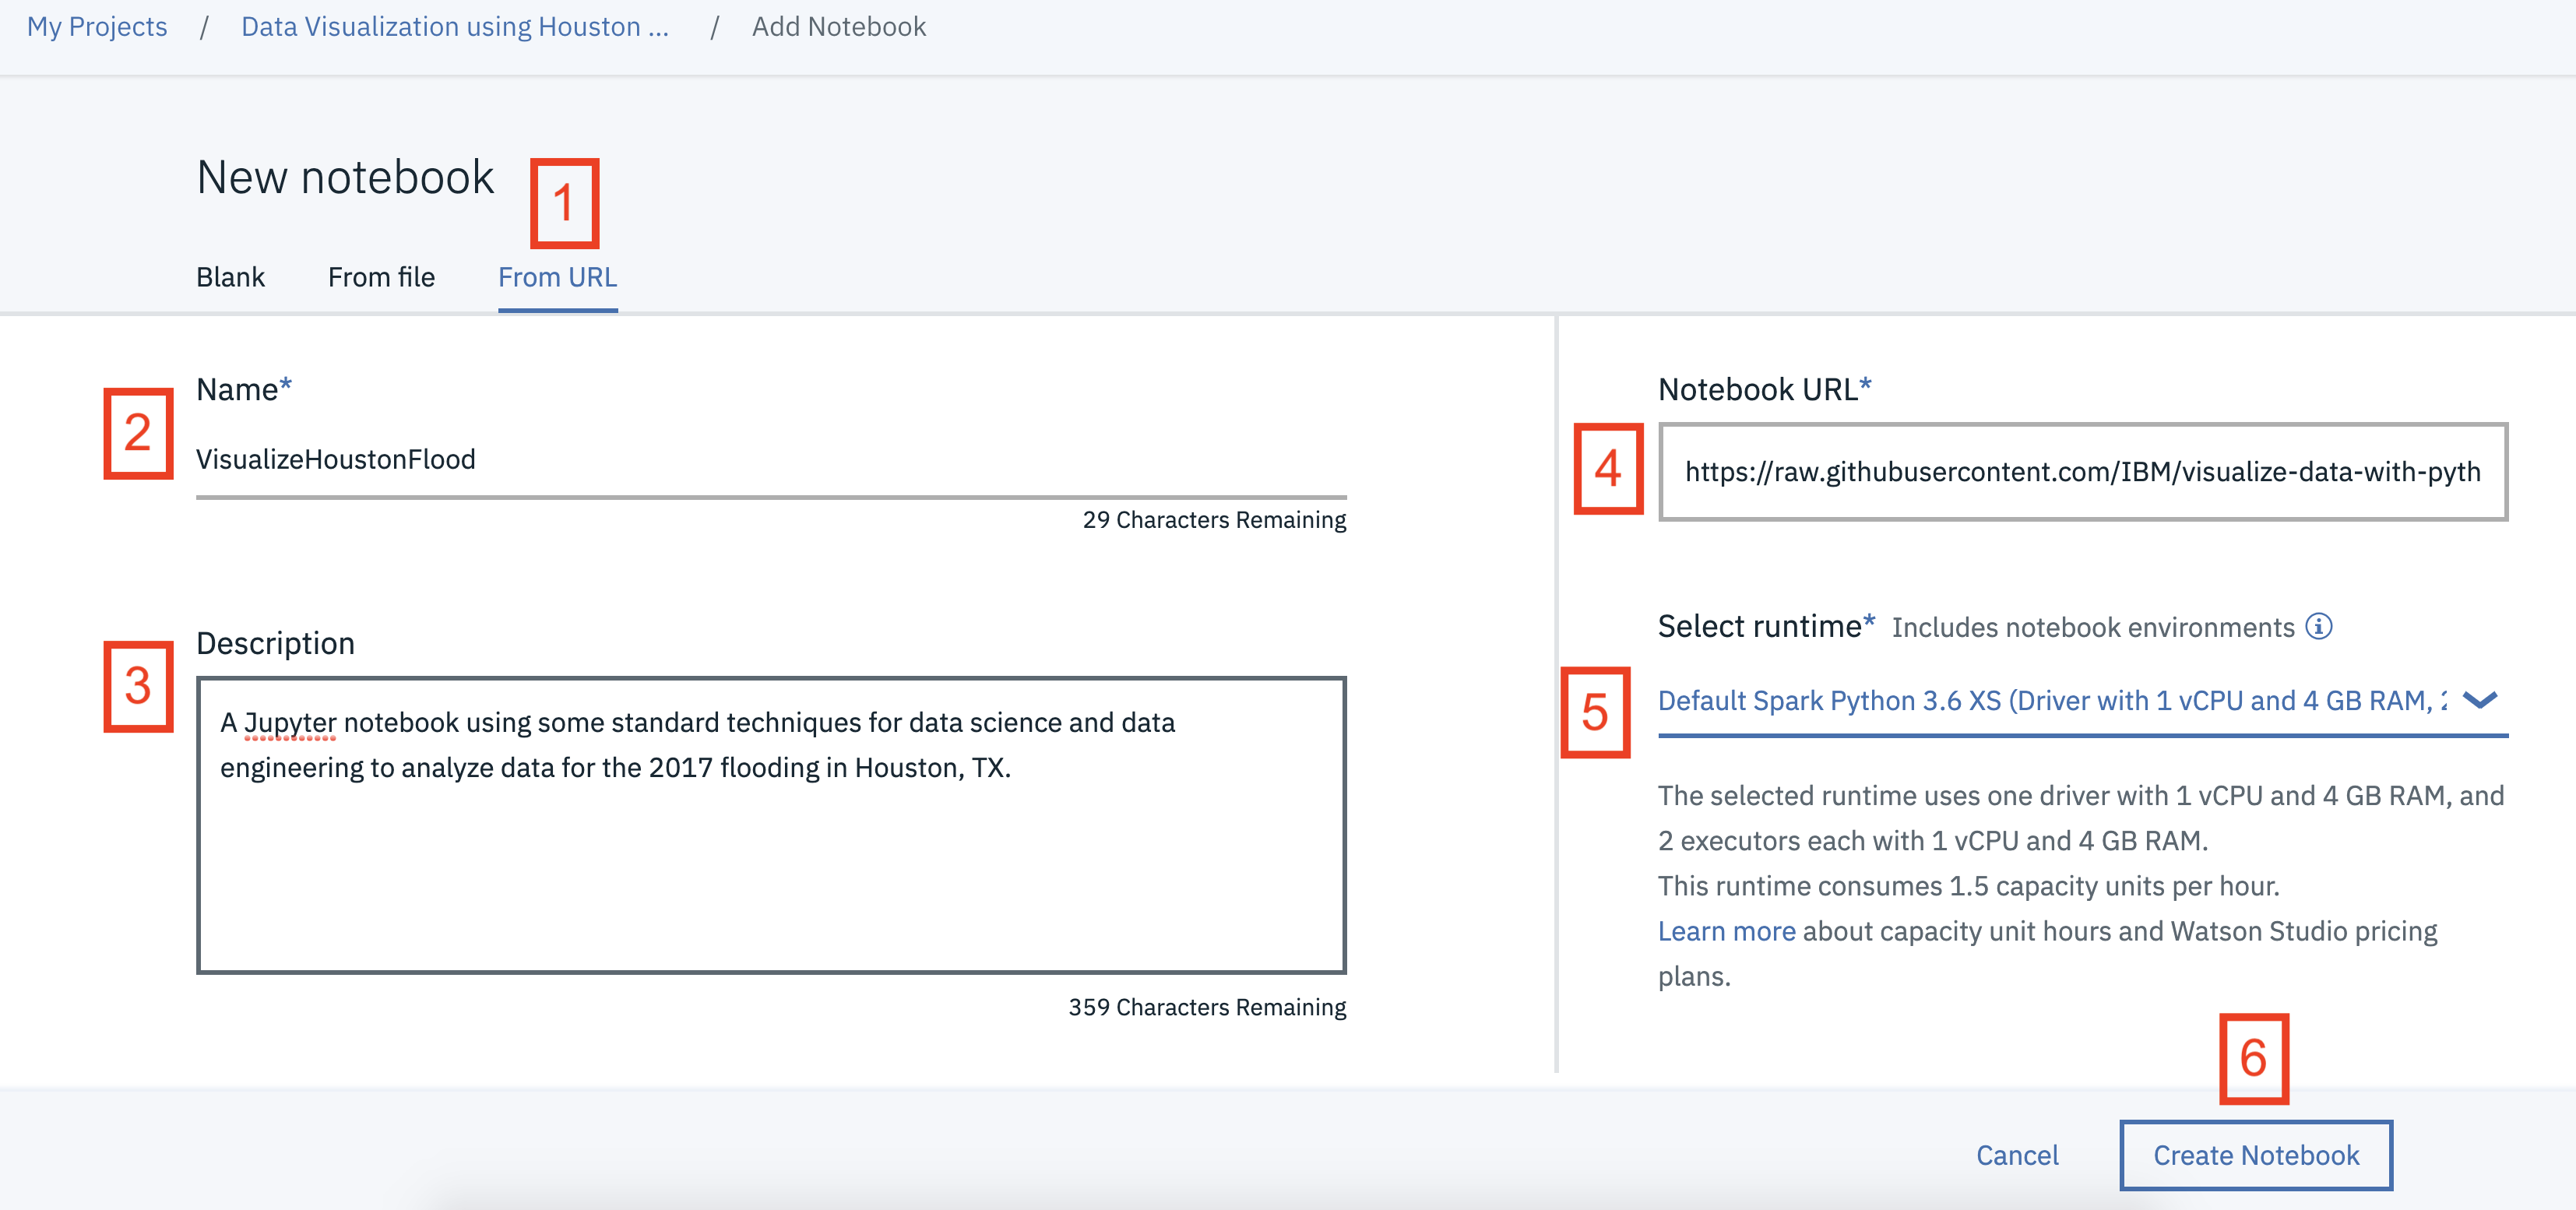
+ Add to projectand then choose theNotebooktile, OR in theAssetstab underNotebookschoose+ New notebookto create a notebook. - Select the
From URLtab. [1] - Enter a name for the notebook. [2]
- Optionally, enter a description for the notebook. [3]
- Under
Notebook URLprovide the following url: https://raw.githubusercontent.com/IBM/visualize-data-with-python/master/notebooks/HoustonFlood2017.ipynb [4] - For
Runtimeselect theSpark Python 3.6option. [5] - Click the
Create notebookbutton. [6]
NOTE: There are points in the notebook where you will have to enter your Mapbox Token to render the map.
When a notebook is executed, what is actually happening is that each code cell in the notebook is executed, in order, from top to bottom.
Each code cell is selectable and is preceded by a tag in the left margin. The tag
format is In [x]:. Depending on the state of the notebook, the x can be:
- A blank, this indicates that the cell has never been executed.
- A number, this number represents the relative order this code step was executed.
- A
*, this indicates that the cell is currently executing.
There are several ways to execute the code cells in your notebook:
- One cell at a time.
- Select the cell, and then press the
Playbutton in the toolbar.
- Select the cell, and then press the
- Batch mode, in sequential order.
- From the
Cellmenu bar, there are several options available. For example, you canRun Allcells in your notebook, or you canRun All Below, that will start executing from the first cell under the currently selected cell, and then continue executing all cells that follow.
- From the
- At a scheduled time.
- Press the
Schedulebutton located in the top right section of your notebook panel. Here you can schedule your notebook to be executed once at some future time, or repeatedly at your specified interval.
- Press the
Note: Some interactive map functionality, like
OptionsandLayerswill not work. To see these, you must run the notebook itself.
This code pattern is licensed under the Apache Software License, Version 2. Separate third party code objects invoked within this code pattern are licensed by their respective providers pursuant to their own separate licenses. Contributions are subject to the Developer Certificate of Origin, Version 1.1 (DCO) and the Apache Software License, Version 2.

